

The diagram shows a sketch of the curve with equation y = f(x). a. Sketch the graph
Question:
The diagram shows a sketch of the curve with equation y = f(x).
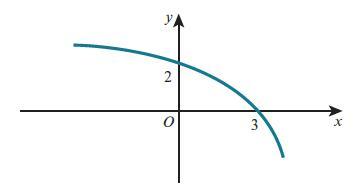 a. Sketch the graph of

b. Describe fully a sequence of two transformations that maps the graph of y = f(x) onto the graph of y = f(3 − x).
Fantastic news! We've Found the answer you've been seeking!
Step by Step Answer:
ANSWER a b To map the graph of y fx onto the graph of y f3 x we can apply a se...View the full answer

Answered By
Churchil Mino
I have been a tutor for 2 years and have experience working with students of all ages and abilities. I am comfortable working with students one-on-one or in small groups, and am able to adapt my teaching style to meet the needs of each individual. I am patient and supportive, and my goal is to help my students succeed.
I have a strong background in math and science, and have tutored students in these subjects at all levels, from elementary school to college. I have also helped students prepare for standardized tests such as the SAT and ACT. In addition to academic tutoring, I have also worked as a swim coach and a camp counselor, and have experience working with children with special needs.
0 Reviews
10+ Question Solved
Related Book For 
Cambridge International AS And A Level Mathematics Pure Mathematics 1 Coursebook
ISBN: 9781108407144
1st Edition
Authors: Sue Pemberton, Julian Gilbey
Question Posted:
