

The diagram shows normal curves for the probability distributions of P and Q, that each contain n
Question:
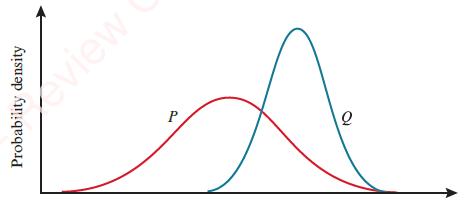
The diagram shows normal curves for the probability distributions of P and Q, that each contain n values.
a. Write down a statement comparing:
i. σP and σQ
ii. The median value for P and the median value for Q
iii. The interquartile range for P and the interquartile range for Q.
b. The datasets P and Q are merged to form a new dataset denoted by W.
i. Describe the range of W.
ii. Is the probability distribution for W a normal curve? Explain your answer.
iii. Copy the diagram above and sketch onto it a curved graph representing the probability distribution for W. Mark the relative positions of μP, μQ and μW along the horizontal axis.
Fantastic news! We've Found the answer you've been seeking!
Step by Step Answer:
a Comparing P and Q i P and Q represent the standard deviations of the probability distributions of P and Q respectively The statement comparing them ...View the full answer

Answered By
CHARLES ODIONYI
I am a post graduate in Economics. Economics is my favorite subject. I was the best outgoing student of my UG and PG batches.I have qualified UGC NET in economics during the year 2018. I worked ad guest lecturer in Economics in Assumption College, Kottayam and SB College, Kottayam. also worked as Economics mentor for preparing aspirants to qualify NET in Economics. I am always curious to prepared self notes in Economics. I completed an internship in Kerala State Planning Board. Also did ASPIRE internship by Government of Kerala.
0 Reviews
10+ Question Solved
Related Book For 

Cambridge International AS & A Level Mathematics Probability & Statistics 1 Coursebook
ISBN: 9781108407304
1st Edition
Authors: Dean Chalmers, Julian Gilbey
Question Posted:
