

The diagram shows the curve and its maximum point M. The shaded region R is enclosed by
Question:
The diagram shows the curve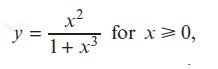 and its maximum point M. The shaded region R is enclosed by the curve, the x-axis and the lines x = 1 and x = p.
i. Find the exact value of the x-coordinate of M.
ii. Calculate the value of p for which the area of R is equal to 1. Give your answer correct to 3 significant figures.
Fantastic news! We've Found the answer you've been seeking!
Step by Step Answer:
i To find the maximum point of the curve y x21 x3 we need to find where the derivat...View the full answer

Answered By
Anik Kumar Bosu
I am expert in Maths, Physics, Chemistry and Biology. I also teach student from 3 years. Students becomes satisfied by my teaching. So, do not worry.
0 Reviews
10+ Question Solved
Related Book For 
Cambridge International AS & A Level Mathematics Pure Mathematics 2 & 3 Coursebook
ISBN: 9781108407199
1st Edition
Authors: Sue Pemberton, Julianne Hughes, Julian Gilbey
Question Posted:
