

The diagram shows the curve y = x 2 e2 x and its maximum point M. i.
Question:
The diagram shows the curve y = x2e2−x and its maximum point M.
i. Show that the x-coordinate of M is 2.
ii. Find the exact value of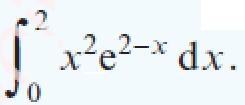
Fantastic news! We've Found the answer you've been seeking!
Step by Step Answer:
ANSWER i To find the maximum point of the curve we need to find the derivat...View the full answer

Answered By
User l_917591
As a Business Management graduate from Moi University, I had the opportunity to work as a tutor for undergraduate students in the same field. This experience allowed me to apply the theoretical knowledge I had gained in a practical setting, while also honing my teaching and communication skills.
As a tutor, I was responsible for conducting tutorial sessions, grading assignments and exams, and providing feedback and support to my students. I also assisted with the preparation of course materials and collaborated with other tutors and professors to ensure consistency in teaching and assessment.
0 Reviews
10+ Question Solved
Related Book For 
Cambridge International AS & A Level Mathematics Pure Mathematics 2 & 3 Coursebook
ISBN: 9781108407199
1st Edition
Authors: Sue Pemberton, Julianne Hughes, Julian Gilbey
Question Posted:
