

The diagram shows the curve y = x 2 ln x and its minimum point M. i.
Question:
The diagram shows the curve y = x2 ln x and its minimum point M.
i. Find the exact values of the coordinates of M.
ii. Find the exact value of the area of the shaded region bounded by the curve, the x-axis and the line x = e.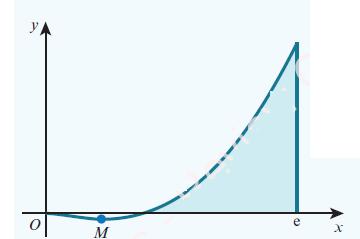
Fantastic news! We've Found the answer you've been seeking!
Step by Step Answer:
i To find the minimum point of the curve y x2 ln x we need to find w...View the full answer

Answered By
Anik Kumar Bosu
I am expert in Maths, Physics, Chemistry and Biology. I also teach student from 3 years. Students becomes satisfied by my teaching. So, do not worry.
0 Reviews
10+ Question Solved
Related Book For 
Cambridge International AS & A Level Mathematics Pure Mathematics 2 & 3 Coursebook
ISBN: 9781108407199
1st Edition
Authors: Sue Pemberton, Julianne Hughes, Julian Gilbey
Question Posted:
