

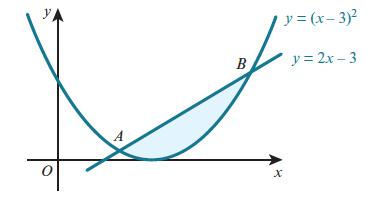
The diagram shows the curve y = (x 3) 2 and the line y = 2x
Question:
The diagram shows the curve y = (x − 3)2 and the line y = 2x − 3 that intersect at points A and B. Find the area of the shaded region.
Fantastic news! We've Found the answer you've been seeking!
Step by Step Answer:
First we need to find the coordinates of points A and B To do this we set the two ...View the full answer

Answered By
Mary Boke
I have teached the student upto class 12th as well as my fellow mates.I have a good command in engineering,maths and science.I scored 90+ marks in 10th and 12th in maths.
0 Reviews
10+ Question Solved
Related Book For 
Cambridge International AS And A Level Mathematics Pure Mathematics 1 Coursebook
ISBN: 9781108407144
1st Edition
Authors: Sue Pemberton, Julian Gilbey
Question Posted:
