

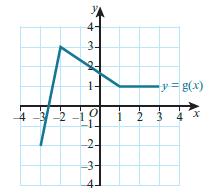
The diagram shows the graph of y = g(x). Sketch the graphs of each of the following
Question:
The diagram shows the graph of y = g(x).
Sketch the graphs of each of the following functions.
a. y = −g(x)
b. y = g(−x)
Fantastic news! We've Found the answer you've been seeking!
Step by Step Answer:
To sketch the graphs of the given functions based on the graph of y gx we can use the following tran...View the full answer

Answered By
Darwin Romero
I use a hands-on technique and am approachable to my students. I incorporate fun into my lessons when possible. And while my easy-going style is suitable for many subjects and grades, I am also able to adapt my style to the needs of the student. I can describe myself as friendly, enthusiastic and respectful. As a teacher, we can easily get respect from the students if they would feel respected first
0 Reviews
10+ Question Solved
Related Book For 
Cambridge International AS And A Level Mathematics Pure Mathematics 1 Coursebook
ISBN: 9781108407144
1st Edition
Authors: Sue Pemberton, Julian Gilbey
Question Posted:
