

The diagram shows the graph of y = f(x) for 4 x 4. Sketch on
Question:
The diagram shows the graph of y = f(x) for −4 ≤ x ≤ 4.
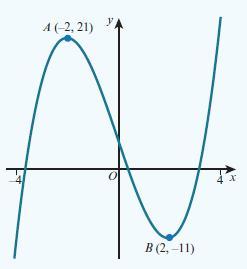
Sketch on separate diagrams, showing the coordinates of any turning points, the graphs of:
a. y = f(x) + 5
b. y = −2f(x)
Fantastic news! We've Found the answer you've been seeking!
Step by Step Answer:
Pa...View the full answer

Answered By
Pushpinder Singh
Currently, I am PhD scholar with Indian Statistical problem, working in applied statistics and real life data problems. I have done several projects in Statistics especially Time Series data analysis, Regression Techniques.
I am Master in Statistics from Indian Institute of Technology, Kanpur.
I have been teaching students for various University entrance exams and passing grades in Graduation and Post-Graduation.I have expertise in solving problems in Statistics for more than 2 years now.I am a subject expert in Statistics with Assignmentpedia.com.
3+ Reviews
10+ Question Solved
Related Book For 

Cambridge International AS And A Level Mathematics Pure Mathematics 1 Coursebook
ISBN: 9781108407144
1st Edition
Authors: Sue Pemberton, Julian Gilbey
Question Posted:
