

The following box plots summarise the percentage scores of a class of students in the three Mathematics
Question:
The following box plots summarise the percentage scores of a class of students in the three Mathematics tests they took this term.
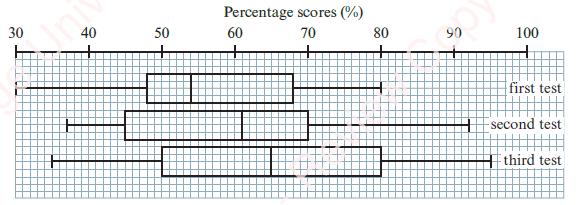
a. Describe the progress made by the class in Mathematics tests this term.
b. Which of the tests has produced the least skewed set of scores?
c. What type of skew do the scores in each of the other two tests have?
Fantastic news! We've Found the answer you've been seeking!
Step by Step Answer:
Based on the provided image of box plots for three mathematics tests we can describe the classs progress and determine the skewness of the score distr...View the full answer

Answered By
Muhammad Umair
I have done job as Embedded System Engineer for just four months but after it i have decided to open my own lab and to work on projects that i can launch my own product in market. I work on different softwares like Proteus, Mikroc to program Embedded Systems. My basic work is on Embedded Systems. I have skills in Autocad, Proteus, C++, C programming and i love to share these skills to other to enhance my knowledge too.
1+ Reviews
10+ Question Solved
Related Book For 

Cambridge International AS & A Level Mathematics Probability & Statistics 1 Coursebook
ISBN: 9781108407304
1st Edition
Authors: Dean Chalmers, Julian Gilbey
Question Posted:
