

The numbers of cobs produced by 360 maize plants are shown in the following table. a. Calculate
Question:
The numbers of cobs produced by 360 maize plants are shown in the following table.
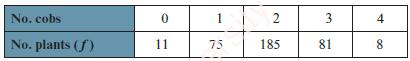
a. Calculate the mean and the standard deviation.
b. Find the interquartile range and give an example of what it tells us about this dataset that the standard deviation does not tell us.
Fantastic news! We've Found the answer you've been seeking!
Step by Step Answer:
To calculate the mean and standard deviation we first need to calculate the sum of the products of e...View the full answer

Answered By
Abdul Wahab Qaiser
Before working at Mariakani, I volunteered at a local community center, where I tutored students from diverse backgrounds. I helped them improve their academic performance and develop self-esteem and confidence. I used creative teaching methods, such as role-playing and group discussions, to make the learning experience more engaging and enjoyable.
In addition, I have conducted workshops and training sessions for educators and mental health professionals on various topics related to counseling and psychology. I have presented research papers at conferences and published articles in academic journals.
Overall, I am passionate about sharing my knowledge and helping others achieve their goals. I believe that tutoring is an excellent way to make a positive impact on people's lives, and I am committed to providing high-quality, personalized instruction to my students.
0 Reviews
10+ Question Solved
Related Book For 

Cambridge International AS & A Level Mathematics Probability & Statistics 1 Coursebook
ISBN: 9781108407304
1st Edition
Authors: Dean Chalmers, Julian Gilbey
Question Posted:
