

The resistances, in ohms (), of 100 conductors are represented in the following graph. Find, to an
Question:
The resistances, in ohms (Ω), of 100 conductors are represented in the following graph.
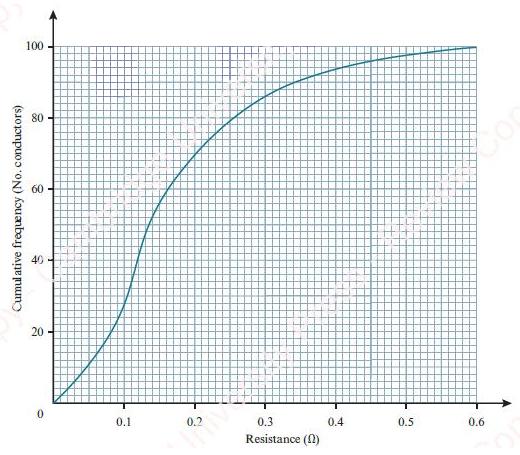
Find, to an appropriate degree of accuracy, an estimate of:
a. The interquartile range
b. The 90th percentile
c. The percentile that is equal to 0.192 Ω
d. The range of the middle 40% of the resistances.
Fantastic news! We've Found the answer you've been seeking!
Step by Step Answer:
The interquartile range IQR is the range between the first quartile Q1 and the third quartile Q3 In this case you can estimate the values of Q1 and Q3 ...View the full answer

Answered By
Akash M Rathod
I have been utilized by educators and students alike to provide individualized assistance with everything from grammar and vocabulary to complex problem-solving in various academic subjects. I can provide explanations, examples, and practice exercises tailored to each student's individual needs, helping them to grasp difficult concepts and improve their skills.
My tutoring sessions are interactive and engaging, utilizing a variety of tools and resources to keep learners motivated and focused. Whether a student needs help with homework, test preparation, or simply wants to improve their skills in a particular subject area, I am equipped to provide the support and guidance they need to succeed.
0 Reviews
10+ Question Solved
Related Book For 

Cambridge International AS & A Level Mathematics Probability & Statistics 1 Coursebook
ISBN: 9781108407304
1st Edition
Authors: Dean Chalmers, Julian Gilbey
Question Posted:
