

This back-to-back stem-and-leaf diagram shows the percentage scores of the 25 students who were the top performers
Question:
This back-to-back stem-and-leaf diagram shows the percentage scores of the 25 students who were the top performers in an examination.
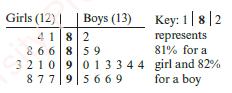
The 25 students are arranged in a line in the order of their scores. Describe the student in the middle of the line and find the greatest possible number of boys in the line who are not standing next to a girl.
Fantastic news! We've Found the answer you've been seeking!
Step by Step Answer:
The stemandleaf diagram shows the percentage scores of the 25 topperforming students in the examinat...View the full answer

Answered By
Monette Taban
I am currently studying Computer Science Engineering, Due to my interest in programming languages and coding, I am interesetd on Technology so I search about it read about different types of technologies, I think my this habbis will help me to solve problems of students and that is why I am signing as a question answer expert.
0 Reviews
10+ Question Solved
Related Book For 

Cambridge International AS & A Level Mathematics Probability & Statistics 1 Coursebook
ISBN: 9781108407304
1st Edition
Authors: Dean Chalmers, Julian Gilbey
Question Posted:
