

Figure 18.18 shows the displacementtime graph for an oscillating mass. Use the graph to determine the following:
Question:
Figure 18.18 shows the displacement–time graph for an oscillating mass. Use the graph to determine the following:
a. Amplitude
b. Period
c. Frequency
d. Angular frequency
e. Displacement at A
f. Velocity at B
g. Velocity at C.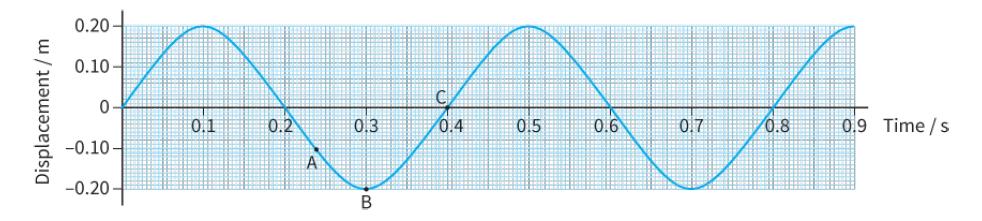
Fantastic news! We've Found the answer you've been seeking!
Step by Step Answer:
From graph amplitude 020m Time period T 04 seconds time ta...View the full answer

Answered By
HARINATH G
I am a Engineering student from a prominent college of Kerala. As a tutor it's my pleasure to share my knowledge.
0 Reviews
10+ Question Solved
Related Book For 
Cambridge International AS And A Level Physics Coursebook
ISBN: 9781108859035
3rd Edition
Authors: David Sang, Graham Jones, Gurinder Chadha, Richard Woodside
Question Posted:
