

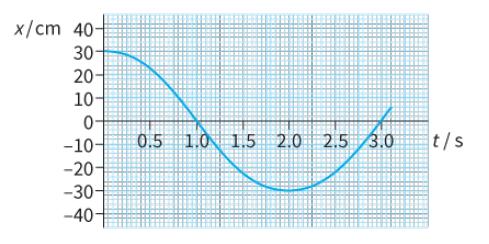
Figure 18.16 shows the displacementtime (xt) graph for an oscillating mass. Use the graph to determine the
Question:
Figure 18.16 shows the displacement–time (x–t) graph for an oscillating mass. Use the graph to determine the following quantities:
a. The velocity in cm s−1 when t = 0 s
b. The maximum velocity in cm s−1
c. The acceleration in cm s−2 when t = 1.0 s.
Fantastic news! We've Found the answer you've been seeking!
Step by Step Answer:
The velocity in cms when t0s cannot be determined from the graph as the velocity is not defined at t...View the full answer

Answered By
Akshay Shete
I have extensive experience as a tutor, both online and in-person. I have worked with students of all ages and abilities, and am skilled at adapting my teaching style to meet the needs of each individual student. I have a strong background in a variety of subjects, including math, science, and English, and am able to break down complex concepts in a way that is easy for students to understand. In addition to my subject matter expertise, I am also a patient and supportive teacher, and am committed to helping my students succeed. Whether I am working with a struggling student who needs extra help to catch up, or an advanced student looking to get ahead, I am able to provide the guidance and support they need to reach their goals. Overall, my hands-on experience as a tutor has prepared me to be a confident and effective teacher, and I am excited to use my skills to help students succeed.
0 Reviews
10+ Question Solved
Related Book For 
Cambridge International AS And A Level Physics Coursebook
ISBN: 9781108859035
3rd Edition
Authors: David Sang, Graham Jones, Gurinder Chadha, Richard Woodside
Question Posted:
