

Figure 29.13 shows the decay of an isotope of caesium, 134 55 Cs. Use the graph to
Question:
Figure 29.13 shows the decay of an isotope of caesium, 13455 Cs. Use the graph to determine the half-life of this nuclide in years, and hence find the decay constant in year−1.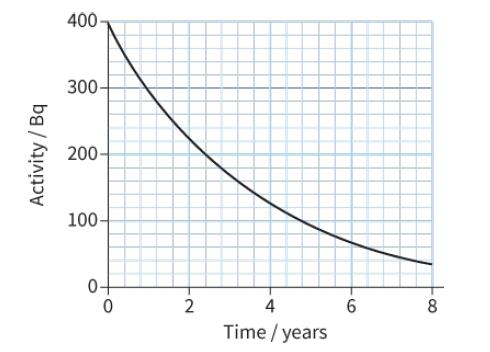
Fantastic news! We've Found the answer you've been seeking!
Step by Step Answer:
ANSWER To determine the halflife of the caesium isotope and its decay consta...View the full answer

Answered By
Collins Njuguna
I graduated from Maseno University with a Bachelor of Science in Applied Statistics. After graduation, I started tutoring students in mathematics. My experience in mathematics education is extensive and varied. I have taught a wide range of topics, including algebra, geometry, trigonometry, calculus, statistics, probability, and computer science. I have also worked with students of all ages and backgrounds, from elementary school to college.
My teaching method is based on the idea of hands-on learning. I believe that students learn best when they are actively engaged in the learning process, so I focus on giving students the tools they need to explore the material on their own. I also emphasize the importance of practice and review, as these are essential for mastering math concepts.
I have also developed several online and in-person courses on mathematics. My courses are designed to help students learn mathematics in an efficient and comprehensive way, and I use a variety of activities and exercises to ensure that my students are engaged and motivated.
Overall, my passion for mathematics and teaching has allowed me to be a successful tutor and educator in the field. I am confident that my experience will help your students master the mathematics they need to succeed.
0 Reviews
10+ Question Solved
Related Book For 
Cambridge International AS And A Level Physics Coursebook
ISBN: 9781108859035
3rd Edition
Authors: David Sang, Graham Jones, Gurinder Chadha, Richard Woodside
Question Posted:
