

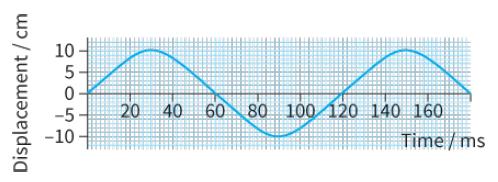
From the displacementtime graph shown in Figure 18.8, determine the amplitude, period and frequency of the oscillations
Question:
From the displacement–time graph shown in Figure 18.8, determine the amplitude, period and frequency of the oscillations represented.
Fantastic news! We've Found the answer you've been seeking!
Step by Step Answer:
Amplitude of any oscillations is the maximum displacement to the either side of me...View the full answer

Answered By
Shivam Jain
Not being a brag, but I have been a prolific academician since my very childhood. I was always amonst the top rankers in primary middle and high school. I did my metriculation from an ICSE affiliated school and scored 96% in the exam. I followed up with an 96.2% in my 12th Boards which I completed from a CBSE affiliated school. Meantime I preppared for my Jee and passed the mains and Advanced level with flying colours.
Speaking of my Tutoring skills, I used to tutor my own classmates in 10th as I hailed from a not so well doing family and needed financial assistance to maintai my educational needs. Going forward I became a chegg expert in chemistry and solved a number of questions as I prepared for Jee on the platform.
Last year I gave local classes to 15 students from Std 8 to 12.
Having taught my own friends and also other students I have learnt to have developed a very patient approach in teaching. Being a student myself I well understand the problems a student may be facing and try my level best to mitigate them. As for the concepts , I am quite confident with every skill I have marked to have knowledge about and am versed enough to teach others about it.
I am pretty good at Physics Chemistry Mathematics and English writing.
0 Reviews
10+ Question Solved
Related Book For 
Cambridge International AS And A Level Physics Coursebook
ISBN: 9781108859035
3rd Edition
Authors: David Sang, Graham Jones, Gurinder Chadha, Richard Woodside
Question Posted:
