

Question: Consider the positiontime graph shown in Figure P2.24. Make a careful graphical estimate of the velocity as a function of time by measuring the slopes
Figure P2.24
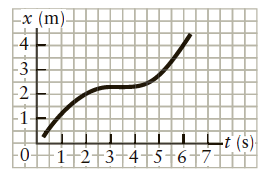
-x (m) -3- -2- -1 Hi (s) -0+i-2-3-4-5-6-7- 4)
Step by Step Solution
★★★★★
3.32 Rating (164 Votes )
There are 3 Steps involved in it
1 Expert Approved Answer
Step: 1 Unlock

Apply graphical analysis of motion including the definition of velocity as the rate of change of pos... View full answer
Question Has Been Solved by an Expert!
Get step-by-step solutions from verified subject matter experts
Step: 2 Unlock
Step: 3 Unlock