

The graph in Figure 10.9 was obtained by measuring the resistance R of a particular thermistor as
Question:
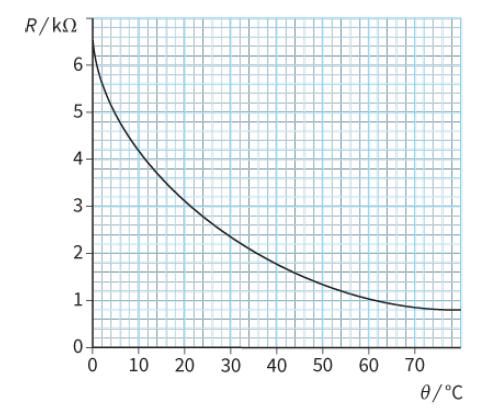
The graph in Figure 10.9 was obtained by measuring the resistance R of a particular thermistor as its temperature θ changed.
a. Determine its resistance at:
i. 20 °C
ii. 45 °C.
b. Determine the temperature when its resistance is:
i. 5000 Ω
ii. 2000 Ω.
Fantastic news! We've Found the answer you've been seeking!
Step by Step Answer:
a i To determine the resistance at 20C we can look at the graph and find the point where ...View the full answer

Answered By
Akshay Shete
I have extensive experience as a tutor, both online and in-person. I have worked with students of all ages and abilities, and am skilled at adapting my teaching style to meet the needs of each individual student. I have a strong background in a variety of subjects, including math, science, and English, and am able to break down complex concepts in a way that is easy for students to understand. In addition to my subject matter expertise, I am also a patient and supportive teacher, and am committed to helping my students succeed. Whether I am working with a struggling student who needs extra help to catch up, or an advanced student looking to get ahead, I am able to provide the guidance and support they need to reach their goals. Overall, my hands-on experience as a tutor has prepared me to be a confident and effective teacher, and I am excited to use my skills to help students succeed.
0 Reviews
10+ Question Solved
Related Book For 
Cambridge International AS And A Level Physics Coursebook
ISBN: 9781108859035
3rd Edition
Authors: David Sang, Graham Jones, Gurinder Chadha, Richard Woodside
Question Posted:
