

In a reaction controlled by an enzyme, which of the following graphs shows the effect of substrate
Question:
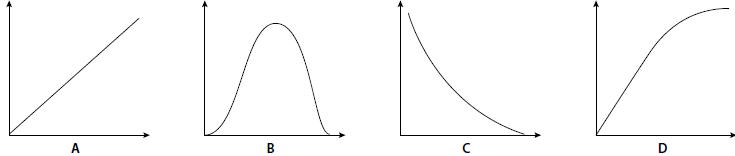
In a reaction controlled by an enzyme, which of the following graphs shows the effect of substrate concentration on the rate of the reaction?
Fantastic news! We've Found the answer you've been seeking!
Step by Step Answer:
Answer The correct option is d In a reaction controlled by an enzyme graphs d shows t...View the full answer

Answered By
Kishan Singh
As I have done BHMS , I have deep knowledge of chemistry and biology. I'm teaching physics chemistry and biology since 2years.
0 Reviews
10+ Question Solved
Related Book For 

Cambridge International AS And A Level Biology
ISBN: 9781107636828
4th Edition
Authors: Mary Jones, Richard Fosbery, Jennifer Gregory, Dennis Taylor
Question Posted:
