

The graph below shows the results of two experiments, A and B. In both cases the uptake
Question:
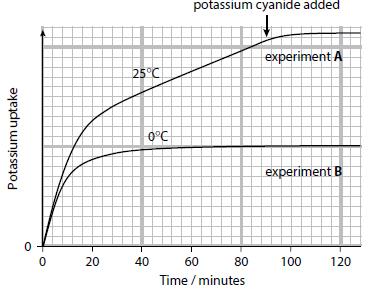
The graph below shows the results of two experiments, A and B. In both cases the uptake of potassium ions into the roots of young plants was measured. Roots were thoroughly washed in pure water before the plants were added to solutions containing potassium ions. Experiment A was carried out at 25 °C and experiment B at 0 °C. In experiment A, potassium cyanide was added to the solution surrounding the roots aft er 90 minutes (see arrow in figure). Potassium cyanide is an inhibitor of respiration.
a. Suggest why the roots were thoroughly washed in pure water before the experiments.
b. Describe the results of experiment A over the first 80 minutes of the experiment.
c. Describe the results of experiment B.
d. Explain the results described in b and c above.
e. Describe the effect of adding potassium cyanide in experiment A.
f. Explain the effect of adding potassium cyanide in experiment A.
Step by Step Answer:

This question has not been answered yet.
You can Ask your question!


Cambridge International AS And A Level Biology
ISBN: 9781107636828
4th Edition
Authors: Mary Jones, Richard Fosbery, Jennifer Gregory, Dennis Taylor
