

The scatter graphs show values for x plotted against values for y. State the letter of any
Question:
The scatter graphs show values for x plotted against values for y.
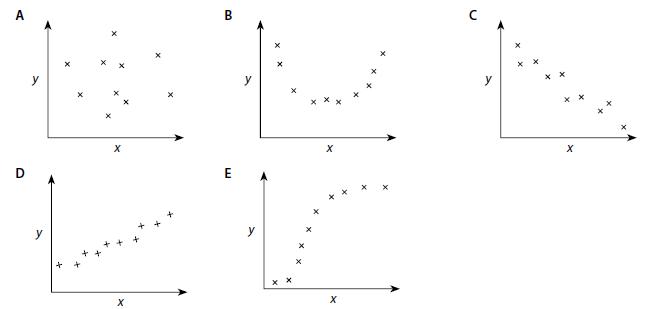
State the letter of any graph or graphs that:
a. Indicate there could be a positive correlation
b. Indicate that there is probably no correlation
c. Indicate that there is a linear correlation
d. Indicate that Spearman’s rank correlation could be used
e. Indicate that Pearson’s linear correlation test could be used
Fantastic news! We've Found the answer you've been seeking!
Step by Step Answer:

Related Book For 

Cambridge International AS And A Level Biology
ISBN: 9781107636828
4th Edition
Authors: Mary Jones, Richard Fosbery, Jennifer Gregory, Dennis Taylor
Question Posted:
