

A student measured the length of 8 randomly selected bean pods and the total mass of the
Question:
A student measured the length of 8 randomly selected bean pods and the total mass of the seeds inside them. The table shows her results.
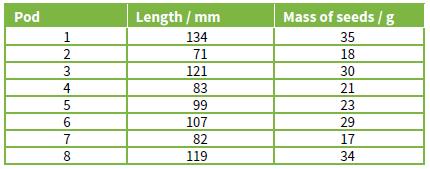
a. Draw a scatter graph of these results.
b. Describe the relationship that is suggested by your scatter graph.
c. Use Pearson’s linear correlation test to analyse these results. Show all of your working, and explain what your calculated value of r suggests about the relationship between the length of a bean pod and the mass of the seeds.
Fantastic news! We've Found the answer you've been seeking!
Step by Step Answer:
A scatterplot is a type of data display that shows the relationship between two numerical variables ...View the full answer

Answered By
Sandra Dimaala
Sandra from Philippines ,LICENSED PROFESSIONAL TEACHER.
Teachers are our nation builders—the strength of every profession in our country grows out of the knowledge and skills that teachers help to instill in our children. And, as a nation, we must do much, much more to fully appreciate and support their work.
0 Reviews
10+ Question Solved
Related Book For 
Cambridge International AS And A Level Biology
ISBN: 9781107636828
4th Edition
Authors: Mary Jones, Richard Fosbery, Jennifer Gregory, Dennis Taylor
Question Posted:
