

When a cell gains or loses water, its volume changes. The graphs show changes in the water
Question:
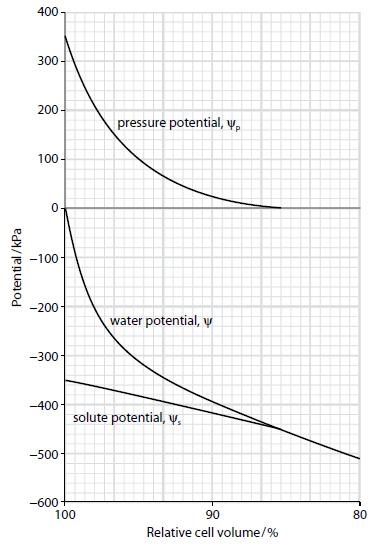
When a cell gains or loses water, its volume changes. The graphs show changes in the water potential (ψ), pressure potential (ψp) and solute potential (ψs) of a plant cell as its volume changes as a result of gaining or losing water. Note that 80% relative cell volume means the cell or protoplast has shrunk to 80% of the volume it was at 100% relative cell volume.
a. What is a protoplast?
b. i. What is the pressure potential at 90%, 95% and 100% relative cell volume?
ii. Calculate the change in pressure potential between 90% and 95% relative cell volume and between 95% and 100% relative cell volume.
iii. Explain why the pressure potential curve is not linear.
iv. State the water potential when the cell reaches maximum turgidity.
The graph above shows that as the cell loses water, pressure potential falls and the relative cell volume decreases (the cell shrinks).
c. i. What is the minimum value of the pressure potential?
ii. In a shrinking cell, what is the relative cell volume when the minimum value of the pressure potential is reached?
iii. What is the term used to describe the state of the cell at this point?
iv. What happens to the values of water potential and solute potential at this point?
v. State the equation which links ψp, ψs and ψ.
vi. Describe what is happening to the cell between the point identified in c ii and c iii above and 80% relative cell volume.
d. As the cell changes volume, the change in solute potential is much less than the change in pressure potential. Suggest an explanation for this.
Step by Step Answer:

This question has not been answered yet.
You can Ask your question!


Cambridge International AS And A Level Biology
ISBN: 9781107636828
4th Edition
Authors: Mary Jones, Richard Fosbery, Jennifer Gregory, Dennis Taylor
