

Question: Analyze Table 9.5 using logit models that treat (a) party affiliation, and (b) ideology, as the response variable. Table 9.5: Observed Frequencies and Fitted Values
Analyze Table 9.5 using logit models that treat (a) party affiliation, and (b) ideology, as the response variable.
Table 9.5:
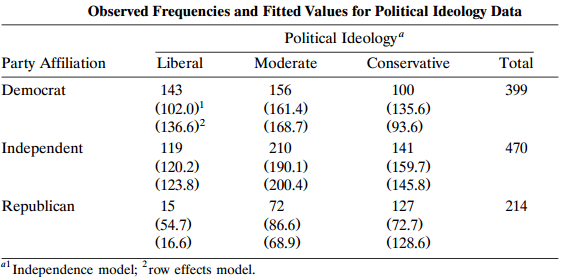
Observed Frequencies and Fitted Values for Political Ideology Data Political Ideology Liberal Party Affiliation Moderate Conservative Total Democrat 143 156 100 399 (102.0) (136.6)? (161.4) (168.7) (135.6) (93.6) Independent 210 141 470 119 (120.2) (123.8) (190.1) (200.4) (159.7) (145.8) Republican 15 72 127 (72.7) (128.6) 214 (54.7) (16.6) (86.6) (68.9) al Independence model; row effects model.
Step by Step Solution
3.35 Rating (161 Votes )
There are 3 Steps involved in it
No part of this publication may be reproduced stored in a retrieval system or transmitted in any for... View full answer

Get step-by-step solutions from verified subject matter experts