

Question: Consider Table 9.13. Explain how one could analyze whether the hazard depends on time. Table 9.13: Number of Deaths from Lung Cancer Follow-up Histology Time
Table 9.13:
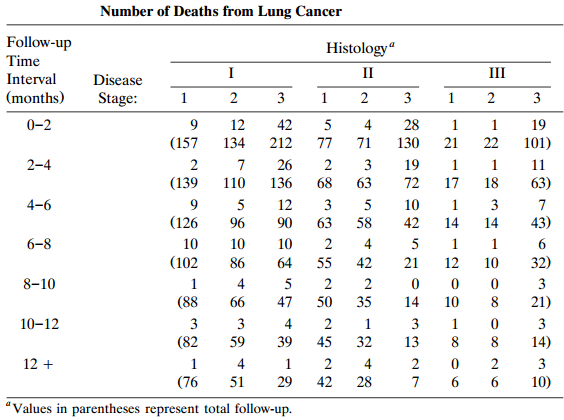
Number of Deaths from Lung Cancer Follow-up Histology Time III I II Interval Disease (months) Stage: 2 3 3 2 0-2 12 42 5 4 28 1 19 (157 134 212 77 71 130 21 22 101) 2-4 2 26 2 3 19 11 (139 110 136 68 63 72 17 18 63) 4-6 5 12 3 5 10 3 (126 43) 96 90 63 58 42 14 14 6-8 10 10 10 2 4 5 6. 1. (102 32) 86 64 55 42 21 12 10 8-10 4 5 2 2 3 (88 66 47 50 35 14 10 21) 10-12 3 3 4 2 3 3 (82 59 39 45 32 13 8. 14) 12 + 4 2 4 2 2 3 (76 51 29 42 28 6. 10) Values in parentheses represent total follow-up. 2.
Step by Step Solution
3.39 Rating (158 Votes )
There are 3 Steps involved in it
Do a likelihoo... View full answer

Get step-by-step solutions from verified subject matter experts