

Question: Fit the RC model to Table 9.3. Interpret the estimated scores. Does it fit better than the uniform association model? Table 9.3: Opinions about Premarital
Fit the RC model to Table 9.3. Interpret the estimated scores. Does it fit better than the uniform association model?
Table 9.3:
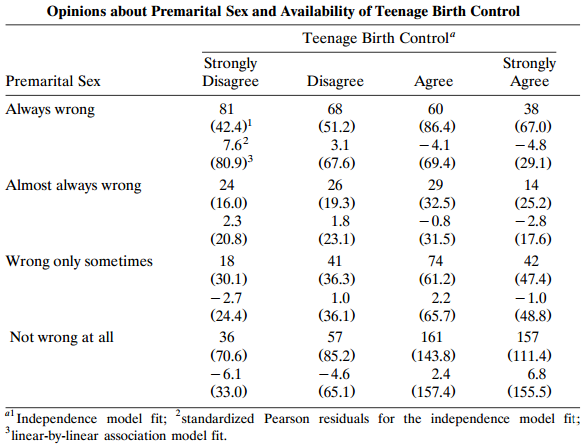
Opinions about Premarital Sex and Availability of Teenage Birth Control Teenage Birth Control Strongly Disagree Strongly Agree Disagree Premarital Sex Agree Always wrong 81 68 60 38 (42.4)' 7.62 (80.9) (51.2) (86.4) - 4.1 (69.4) (67.0) - 4.8 3.1 (67.6) (29.1) Almost always wrong 24 26 29 14 (32.5) (16.0) 2.3 (20.8) (19.3) (25.2) - 2.8 (17.6) 1.8 -0.8 (23.1) (31.5) Wrong only sometimes 18 41 74 42 (30.1) - 2.7 (24.4) (36.3) (61.2) 2.2 (65.7) (47.4) - 1.0 (48.8) 1.0 (36.1) Not wrong at all 36 57 157 161 (70.6) - 6.1 (33.0) (85.2) (143.8) (111.4) -4.6 2.4 (157.4) 6.8 (65.1) (155.5) al "Independence model fit; "standardized Pearson residuals for the independence model fit; *linear-by-linear association model fit.
Step by Step Solution
3.43 Rating (172 Votes )
There are 3 Steps involved in it
ANSWER The RC model is a type of item response theory model that assumes that each item has a diffi... View full answer

Get step-by-step solutions from verified subject matter experts