

Question: For Table 5.3, conduct the trend test using alcohol consumption scores (1, 2, 3, 4, 5) instead of (0.0, 0.5, 1.5, 4.0, 7.0). Compare results,
For Table 5.3, conduct the trend test using alcohol consumption scores (1, 2, 3, 4, 5) instead of (0.0, 0.5, 1.5, 4.0, 7.0). Compare results, noting the sensitivity to the choice of scores for highly unbalanced data.
Table 5.3:
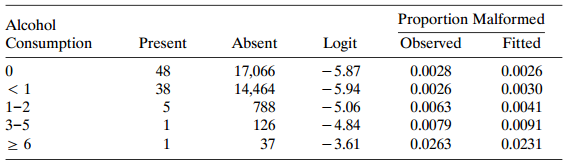
Proportion Malformed Fitted Alcohol Consumption Logit - 5.87 Absent Present Observed 17,066 14,464 48 0.0028 0.0030 0.0041 0.0091 0.0231 38 5 - 5.94 0.0063 1-2 3-5 788 126 - 5.06 - 4.84 - 3.61 0.0079 37 0.0263
Step by Step Solution
★★★★★
3.42 Rating (165 Votes )
There are 3 Steps involved in it
1 Expert Approved Answer
Step: 1 Unlock

Question Has Been Solved by an Expert!
Get step-by-step solutions from verified subject matter experts
Step: 2 Unlock
Step: 3 Unlock