

Question: Perform a residual analysis for the independence model with Table 3.2. Explain why it suggests that the linear-by-linear association model may fit better. Fit it,
Perform a residual analysis for the independence model with Table 3.2. Explain why it suggests that the linear-by-linear association model may fit better. Fit it, compare to the independence model, and interpret.
Table 3.2:
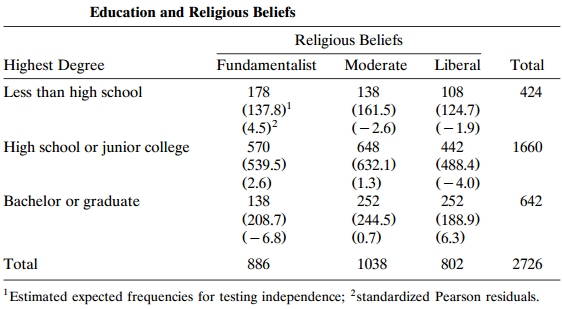
Education and Religious Beliefs Religious Beliefs Highest Degree Fundamentalist Moderate Liberal Total 138 (161.5) (-2,6) Less than high school 178 108 424 (137.8)' (4.5)? (124.7) (-1,9) High school or junior college 570 648 (632.1) (1.3) 252 (244.5) (0.7) 442 1660 (539.5) (2.6) (488.4) (-4.0) 252 (188.9) (6.3) Bachelor or graduate 138 642 (208.7) (-6,8) Total 886 1038 802 2726 'Estimated expected frequencies for testing independence; ?standardized Pearson residuals.
Step by Step Solution
3.47 Rating (163 Votes )
There are 3 Steps involved in it
ANSWER To perform a residual analysis for the independence model with Table 32 we first need to calculate the standardized Pearson residuals The formu... View full answer

Get step-by-step solutions from verified subject matter experts