

Question: Refer to Table 7.8. For the combined data for the two genders, yielding a single 4 Ã 4 table, X 2 = 11.5 (P =
Table 7.8:
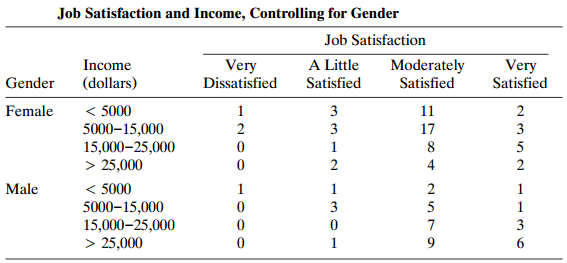
Job Satisfaction and Income, Controlling for Gender Job Satisfaction A Little Moderately Satisfied Income Very Dissatisfied Very Satisfied Gender (dollars) Satisfied < 5000 5000-15,000 15,000-25,000 > 25,000 < 5000 Female 3 11 3 17 3 5 2 4 Male 2 5000-15,000 15,000-25,000 > 25,000 3 5 1 3 6.
Step by Step Solution
★★★★★
3.36 Rating (159 Votes )
There are 3 Steps involved in it
1 Expert Approved Answer
Step: 1 Unlock

The X 2 statistic has df 9 and is designed for the g... View full answer
Question Has Been Solved by an Expert!
Get step-by-step solutions from verified subject matter experts
Step: 2 Unlock
Step: 3 Unlock