

Question: Refer to Table 8.3. Viewing the table as matched triplets, construct the marginal distribution for each substance. Find the sample proportions of students who used
Table 8.3:
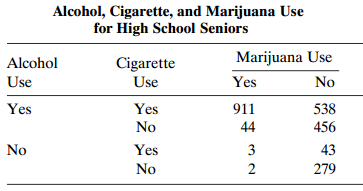
Alcohol, Cigarette, and Marijuana Use for High School Seniors Marijuana Use Alcohol Cigarette Use Use Yes No Yes Yes 911 538 No 44 456 No Yes 3 43 No 2 279
Step by Step Solution
★★★★★
3.43 Rating (159 Votes )
There are 3 Steps involved in it
1 Expert Approved Answer
Step: 1 Unlock

The sample proportions of yes responses are 86 for ... View full answer
Question Has Been Solved by an Expert!
Get step-by-step solutions from verified subject matter experts
Step: 2 Unlock
Step: 3 Unlock