

Question: Refer to the loglinear models for Table 8.8. a. Explain why the fitted odds ratios in Table 8.10 for model (GI, GL, GS, IL, IS,
a. Explain why the fitted odds ratios in Table 8.10 for model (GI, GL, GS, IL, IS, LS) suggest that the most likely accident case for injury is females not wearing seat belts in rural locations.
b. Fit model (GLS, GI, IL, IS). Using model parameter estimates, show that the fitted IS conditional odds ratio equals 0.44. Show that for each injury level, the estimated conditional LS odds ratio is 1.17 for (G = female) and 1.03 for (G = male). How can you get these using the model parameter estimates?
Table 8.8:
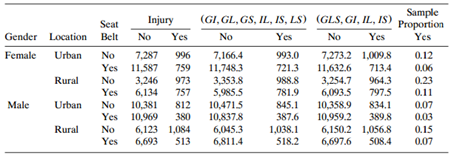
Table 8.10:
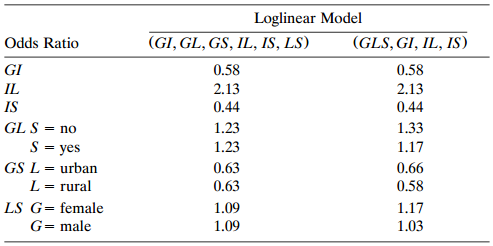
Injury (GI, GL, GS, IL, IS, LS) (GLS, GI, IL, IS) Sample Seat Gender Location Belt Proportion Yes No No Yes Yes 993.0 721.3 988.8 781.9 845.1 387.6 1,038.1 518.2 Yes No No Female 0.12 Urban No 7,287 996 7,166.4 11,748.3 3,353.8 5,985.5 10,471.5 10,837.8 6,045.3 6,811.4 7,273.2 1,009.8 11,632.6 11,587 973 759 713.4 Yes 0.06 No 3,246 6,134 10,381 10,969 6,123 1,084 6,693 3,254.7 964.3 0.23 Rural 6,093.5 757 797.5 Yes 0.11 Male Urban No Yes No 10,358.9 834.1 812 0.07 0.03 380 10,959.2 389.8 6,150.2 1,056.8 508.4 Rural 6,697.6 Yes 513 0.07 Loglinear Model Odds Ratio (GI, GL, GS, IL, IS, LS) (GLS, GI, IL, IS) GI 0.58 0.58 IL 2.13 2.13 IS 0.44 0.44 GL S = no 1.23 1.33 S = yes 1.23 1.17 GS L = urban 0.63 0.66 L = rural 0.63 0.58 LS G= female 1.09 1.17 G= male 1.09 1.03
Step by Step Solution
3.29 Rating (155 Votes )
There are 3 Steps involved in it
Injury has estimated conditional odds ratios 58 with gender 213 with location a... View full answer

Get step-by-step solutions from verified subject matter experts