

Question: Refer to the tea-tasting data (Table 3.8). Construct the null distributions of the ordinary P-value and the mid-P-value for Fishers exact test with H α
Table 3.8:
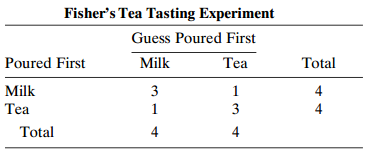
Fisher's Tea Tasting Experiment Guess Poured First Poured First Milk Tea Total Milk 3 4 Tea 3 Total 4 4
Step by Step Solution
★★★★★
3.46 Rating (159 Votes )
There are 3 Steps involved in it
1 Expert Approved Answer
Step: 1 Unlock

P 0164 P 00035 ta... View full answer
Question Has Been Solved by an Expert!
Get step-by-step solutions from verified subject matter experts
Step: 2 Unlock
Step: 3 Unlock