Question:
Table 11.11 is from a Kansas State University survey of 262 pig farmers. For the question €œWhat are your primary sources of veterinary information?,€ the categories were (A) professional consultant, (B) veterinarian, (C) state or local extension service, (D) magazines, and (E) feed companies and reps. Farmers sampled were asked to select all relevant categories. The 2
5× 2 × 4 table shows the (yes, no) counts for each of these five sources cross-classified with the farmers€™ education (whether they had at least some college education) and size of farm (number of pigs marketed annually, in thousands).
a. Explain why it is not proper to analyze the data by fitting a multinomial model to the counts in the 2 × 4 × 5 contingency table cross-classifying education by size of farm by the source of veterinary information, treating source as the response variable. (This table contains 453 positive responses of sources from the 262 farmers.)
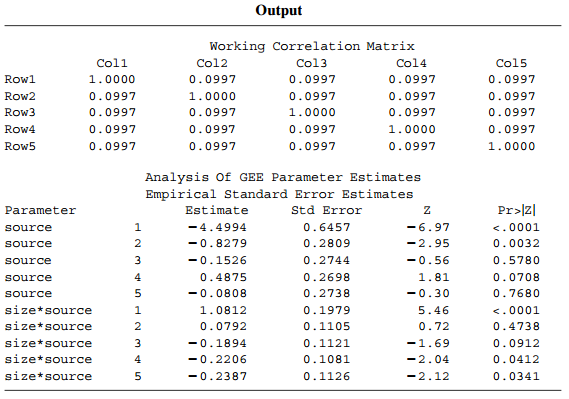
b. For a farmer with education i and size of farm s, let Ï€j(is) denote the probability of responding €œyes€ on the jth source. Table 11.12 shows output for using GEE with exchangeable working correlation to estimate parameters in the model lacking an education effect,
logit[πj(is)] = αj + βjs, s = 1, 2, 3, 4.
Explain how to interpret the working correlation matrix. Explain why the results suggest a strong positive size of farm effect for source A and perhaps a weak negative size effect of similar magnitude for C, D, and E.
c. Constraining β3 = β4 = β5, the ML estimate of the common slope is €“ 0.184 (SE = 0.063). Explain why it is advantageous to fit the marginal model simultaneously for all sources rather than separately to each. [Agresti and Liu (1999) and Loughin and Scherer (1998) discussed analyses for data of this form.]
Table 11.11:
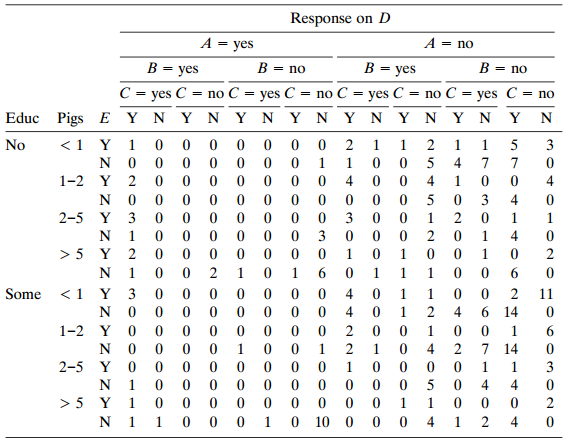
Table 11.12:
Transcribed Image Text:
Response on D A = no = yes B = yes B = no B = no B = yes %3D C = yes C = no C = yes C = no C = yes C = no C = yes C Y N Y N Y N = no Y N Y N Educ Pigs ΕΕΥΝ Y N N No 5 3 5 4 1 Y 2 1-2 4 4 4 5 3 4 2-5 Y 3 0 0 0 0 0 0 0 3 0 0 1 2 0 1 N 1 0 0 0 0 0 0 3 0 0 0 2 0 1 4 1 2 1 1 N 1 0 0 2 1 0 1 6 0 1 1 1 0 0 6 0 Some 3 4 1 11 N O 0 0 0 0 0 0 0 4 0 1 2 4 6 14 1-2 Y 0 0 0 0 0 0 0 0 2 0 0 1 0 0 1 7 14 4 2 2-5 Y 0 0 0 0 0 0 0 0 1 0 0 0 0 1 1 N 1 0 0 0 0 0 0 0 0 0 0 5 0 4 4 > 5 3 N 1 10 4 2 4 Output Working Correlation Matrix Coll Col2 Col3 Col4 Col5 Rowl 1.0000 0.0997 0.0997 0.0997 0.0997 Row2 0.0997 1.0000 0.0997 0.0997 0.0997 Row3 0.0997 0.0997 1.0000 0.0997 0.0997 Row4 0.0997 0.0997 0.0997 1.0000 0.0997 Row5 0.0997 0.0997 0.0997 0.0997 1.0000 Analysis Of GEE Parameter Estimates Empirical Standard Error Estimates Parameter Estimate Std Error Pr>|z| source -4.4994 0.6457 -6.97 <.0001 source -0.8279 0.2809 -2.95 0.0032 source -0.1526 0.2744 -0.56 0.5780 source 0.4875 0.2698 1.81 0.0708 source -0.0808 0.2738 -0.30 0.7680 size*source 1.0812 0.1979 5.46 <.0001 size*source 0.0792 0.1105 0.72 0.4738 size*source -0.1894 0.1121 -1.69 0.0912 size*source -0.2206 0.1081 -2.04 0.0412 size*source -0.2387 0.1126 -2.12 0.0341