

Question: Table 12.16 reports results from a study to estimate the number N of people infected during a 1995 hepatitis A outbreak in Taiwan. The 271
The random effects model of Section 12.3.6 has fit shown in Table 12.16, for which σ̂ = 2.9. The log-likelihood is relatively flat, and NÌ‚ = 4551 with a 95% profile likelihood interval of (758, ˆž) (Coull and Agresti 1999). Explain why this model may provide imprecise estimates of N. Since the interval in part (c) is much narrower, is it necessarily more reliable?
Table 12.16:
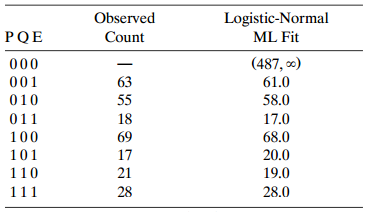
Logistic-Normal Observed PQE Count ML Fit (487, 0) 000 001 63 61.0 010 55 58.0 011 18 17.0 100 69 68.0 101 17 20.0 110 21 19.0 28 28.0 111
Step by Step Solution
3.45 Rating (148 Votes )
There are 3 Steps involved in it
When is large the log likelihood is flat and many ... View full answer

Get step-by-step solutions from verified subject matter experts