

Question: Table 7.17 is an expanded version of a data set analyzed in Section 8.4.2. The response categories are (1) not injured, (2) injured but not
a. Why are there four intercepts? Explain how they determine the estimated response distribution for males in urban areas wearing seat belts.
b. Construct a confidence interval for the effect of gender, given seat-belt use and location. Interpret.
c. Find the estimated cumulative odds ratio between the response and seat-belt use for those in rural locations and for those in urban locations, given gender. Based on this, explain how the effect of seat-belt use varies by region, and explain how to interpret the interaction estimate, €“0.1244.
Table 7.17:
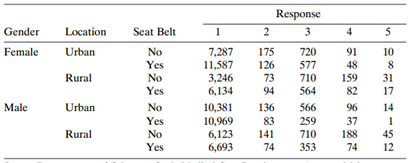
Table 7.18:
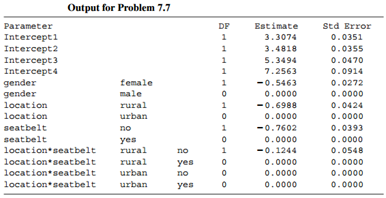
Response 3 Gender Location Seat Belt Female Urban 7,287 11,587 3,246 6,134 10,381 10,969 6,123 6,693 175 720 577 91 48 159 82 96 37 188 10 No Yes 126 Rural 73 94 136 83 141 74 710 710 564 31 17 No Yes Male Urban 566 259 710 353 14 No Yes Rural 45 74 No Yes 12 2. Output for Problem 7.7 Parameter DF Estimate Std Error 3.3074 Intercept1 Intercept2 0.0351 3.4818 0.0355 Intercept3 Intercept4 gender gender location 5.3494 0.0470 7.2563 0.0914 female -0.5463 0.0000 0.0272 le 0.0000 rural -0.6988 0.0424 location urban 0.0000 0.0000 eatbelt no -0.7602 0.0393 seatbelt yes 0.0000 0.0000 location seatbelt rural no -0.1244 0.0548 location*seatbelt rural urban y 0.0000 0.0000 location*seatbelt no 0.0000 0.0000 location seatbelt urban 0.0000 0.0000 yes
Step by Step Solution
3.52 Rating (162 Votes )
There are 3 Steps involved in it
a Four intercepts are needed for five response categories For males in urb... View full answer

Get step-by-step solutions from verified subject matter experts