

a. What would Figure 2-2 look like if we plotted y2 vs. X2 (i.e., plot less volatile
Question:
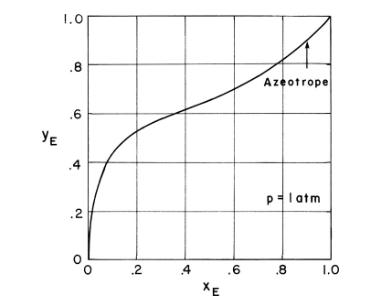
a. What would Figure 2-2 look like if we plotted y2 vs. X2 (i.e., plot less volatile component mole fractions)?
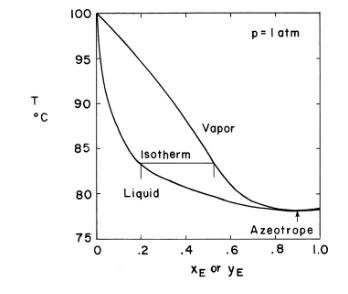
b. What would Figure 2-3 look like if we plotted T vs. X2 or y2 (less volatile component)?
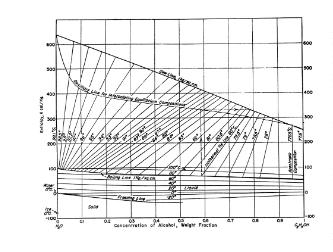
c. What would Figure 2-4 look like if we plotted H or h vs. y2 or x2 (less volatile component)?
Step by Step Answer:

This question has not been answered yet.
You can Ask your question!
Related Book For 
Separation Process Engineering Includes Mass Transfer Analysis
ISBN: 9780137468041
5th Edition
Authors: Phillip Wankat
Question Posted:
