

Figure 26.8 shows that the thermal conductivity of (mathrm{S} 3) and (mathrm{S} 4) increased by (30.25 %)
Question:
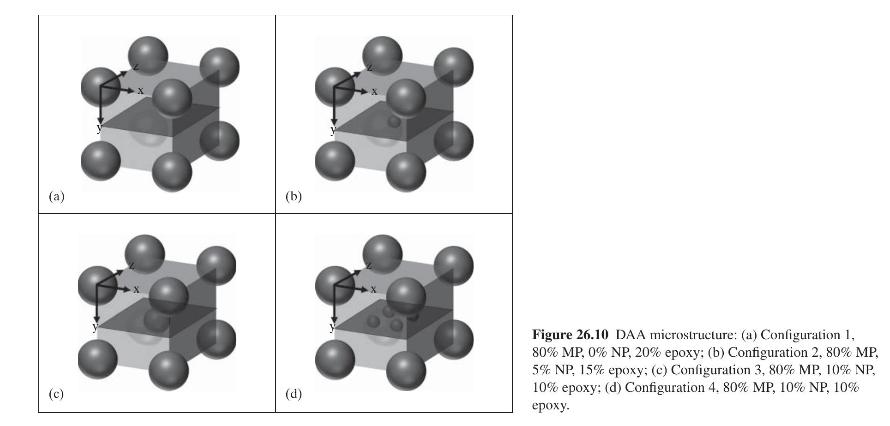
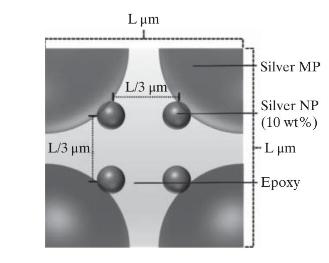
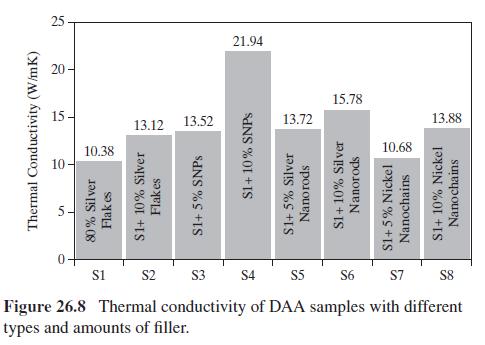
Figure 26.8 shows that the thermal conductivity of \(\mathrm{S} 3\) and \(\mathrm{S} 4\) increased by \(30.25 \%\) and \(111.37 \%\) by adding \(5 \mathrm{wt} \%\) and \(10 \mathrm{wt} \%\) of silver nanoparticles (NPs), respectively, to S1 with \(80 \mathrm{wt} \%\) silver flakes. There are many more NPs than silver flakes, to be represented by spherical microparticles (MPs), because the NPs are much smaller. The way in which the MPs mix with the NPs is also not known. However, to better understand the effect of the type and amount of silver filler on thermal conductivity, the four configurations in Figure 26.10 are assumed.
Thus, configuration 1 , representing sample \(\mathrm{S} 1\), does not contain any NPs. Configuration 2, representing S2, and configuration 3, representing S4, have one. Configuration 4, also representing sample S4, has four NPs. As shown in the following cross-sectional cut for configuration 3, each configuration is a unit cell, which repeats itself within the adhesive layer. There is one microparticle in each unit cell.
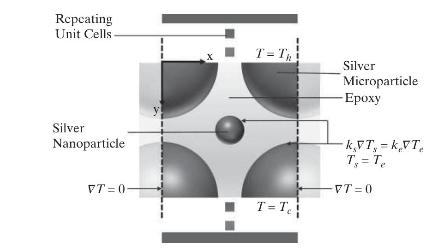
This steady-state, heat conduction problem is governed by the following equation:
\[k abla^{2} T=0\]
for both silver and epoxy phases and the boundary conditions:
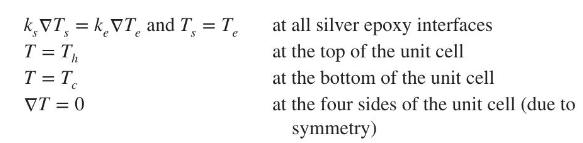
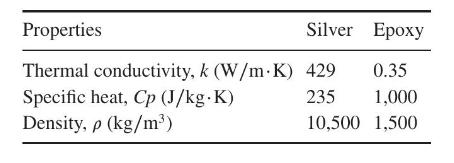
The thermal conductivity, specific heat, and density are given in the following table (http://www.engineeringtoolbox.com):
In addition, it is given that the microparticles have a radius of \(1.2 \mu \mathrm{m}\). The adhesive layer has a thickness of \(51 \mu \mathrm{m}\). The temperature on the LED chip is \(127^{\circ} \mathrm{C}\), and the temperature on the substrate is \(110^{\circ} \mathrm{C}\).
Based on these data, determine the effective thermal conductivity of each configuration using simulation packages such as COMSOL Multiphysics. The following procedure can be used for configuration 4 (see the following cross-sectional cut) although it can be used for other configurations with minor modifications.
(a) Calculate the length of each side of the cubic unit cell, \(\mathrm{L}\) for the given weight percentages of the components.
(b) Determine the diameter of the NP if any is present.
(c) Calculate the number of unit cells across the adhesive layer.
(d) Assuming a linear temperature profile across the adhesive layer, calculate the temperature at the top \(\left(T_{h}\right)\) and the bottom \(\left(T_{c}\right)\) of the unit cell.
(e) Run the software with the data and the parameters calculated.
(f) Finally, compare the trend of the calculated effective thermal conductivity with the trend of the experimental data in Figure 26.8.
Figure 26.8:-
Step by Step Answer:


Product And Process Design Principles Synthesis Analysis And Evaluation
ISBN: 9781119355243
4th Edition
Authors: Warren D. Seider, Daniel R. Lewin, J. D. Seader, Soemantri Widagdo, Rafiqul Gani, Ka Ming Ng
