

Draw a heating curve (such as the one in Figure 12.36) for 1 mole of methanol beginning
Question:
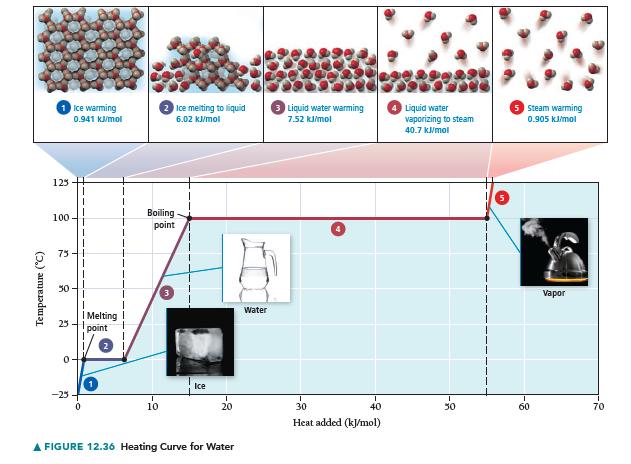
Draw a heating curve (such as the one in Figure 12.36) for 1 mole of methanol beginning at 170 K and ending at 350 K.
Assume that the values given here are constant over the relevant temperature ranges.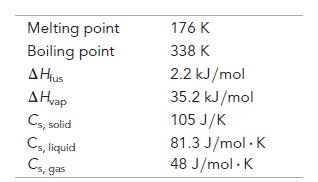
Fantastic news! We've Found the answer you've been seeking!
Step by Step Answer:
Temperature K ...View the full answer

Answered By
Mercy chelangat
I have experience as a tutor as i have been tackling academic works in two companies which are course hero and Nerdy company. Professionalism is what i always observe in my work and thus any issue i normally raise it professionally. I always prioritizes the needs of my students and that is why i always do the work and present to the students promptly. Also, my work is original and not plagiarized.
I posses various skills in writing as required in the academic field. From the experience that i have, i handle 98% of the questions given with ease and thus i see the need to work with the various students worldwide. I can diligently handle statistics and economics questions and this can be even proved from my good grades from the provisional results that i have posted.
0 Reviews
10+ Question Solved
Related Book For 

Question Posted:
