

Draw a heating curve (such as the one in Figure 12.36) for 1 mol of benzene beginning
Question:
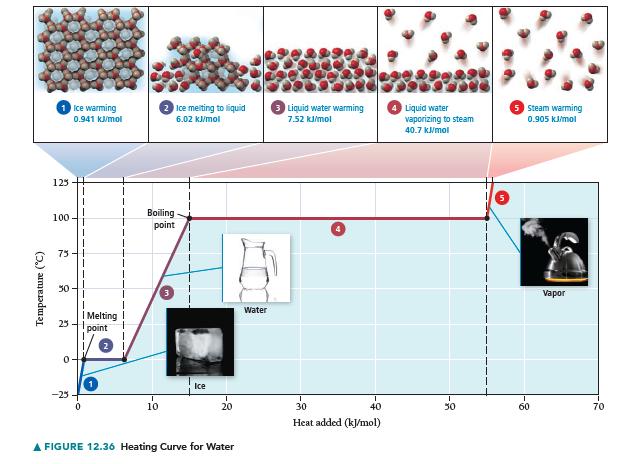
Draw a heating curve (such as the one in Figure 12.36) for 1 mol of benzene beginning at 0 °C and ending at 100 °C. Assume that the values given here are constant over the relevant temperature ranges.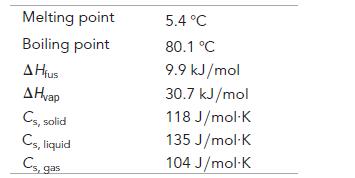
Fantastic news! We've Found the answer you've been seeking!
Step by Step Answer:
Temp Heat added 0 solid 0 54 solid 118 Jmol 1 K 1 x 1mol x 54 0C 6372 J 54 L...View the full answer

Answered By
Dinesh F
I have over 3 years of professional experience as an assignment tutor, and 1 year as a tutor trainee.
1+ Reviews
10+ Question Solved
Related Book For 
Question Posted:
