

A graph of binding energy per nucleon is shown in Figure 25.4. Explain how the data used
Question:
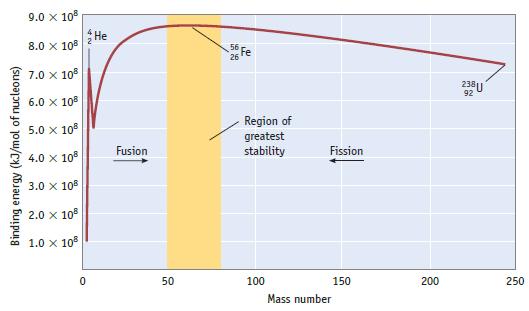
A graph of binding energy per nucleon is shown in Figure 25.4. Explain how the data used to construct this graph were obtained.
Data given in Figure 25.4
Fantastic news! We've Found the answer you've been seeking!
Step by Step Answer:
The data used to construct the graph of binding energy per nucleon in Figure 254 were obtained from a series of experiments that were conducted at the ...View the full answer

Answered By
Susan Juma
I'm available and reachable 24/7. I have high experience in helping students with their assignments, proposals, and dissertations. Most importantly, I'm a professional accountant and I can handle all kinds of accounting and finance problems.
15+ Reviews
45+ Question Solved
Related Book For 
Chemistry And Chemical Reactivity
ISBN: 9780357001172
10th Edition
Authors: John C. Kotz, Paul M. Treichel, John Townsend, David Treichel
Question Posted:
