

The graph below shows the change in pressure as the temperature increases for a 1-mol sample of
Question:
The graph below shows the change in pressure as the temperature increases for a 1-mol sample of a gas confined to a 1-L container. The four plots correspond to an ideal gas and three real gases: CO2, N2, and Cl2.
(a) At room temperature, all three real gases have a pressure less than the ideal gas. Which van der Waals constant, a or b, accounts for the influence intermolecular forces have in lowering the pressure of a real gas?
(b) Use the van der Waals constants in Table 10.3 to match the labels in the plot (A, B, and C) with the respective gases (CO2, N2, and Cl2).
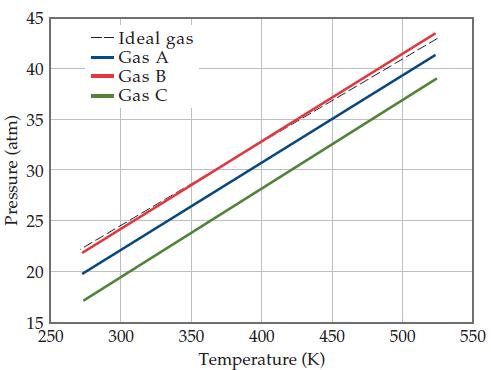
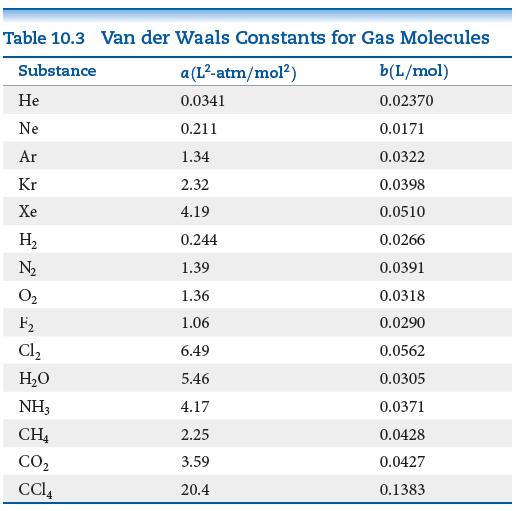
Table : 10.3
Fantastic news! We've Found the answer you've been seeking!
Step by Step Answer:
a In the van der Waals equation of state which accounts for the deviations of real gases from ideal ...View the full answer

Related Book For 

Chemistry The Central Science
ISBN: 9780321910417
13th Edition
Authors: Theodore E. Brown, H. Eugene LeMay, Bruce E. Bursten, Catherine Murphy, Patrick Woodward, Matthew E. Stoltzfus
Question Posted:
