

Question: Exercises 23 and 24: Use the table to make a scatterplot and line graph of the data. Atmospheric CO 2 Levels (parts per million) Year
Exercises 23 and 24: Use the table to make a scatterplot and line graph of the data.
Atmospheric CO2 Levels (parts per million)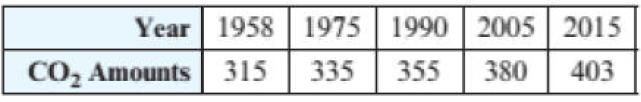
Year 1958 CO Amounts 1975 1990 2005 2015 355 380 403 315 335
Step by Step Solution
★★★★★
3.42 Rating (161 Votes )
There are 3 Steps involved in it
1 Expert Approved Answer
Step: 1 Unlock

CO levels ppm 450 400 350 300 250 200 150 1... View full answer
Question Has Been Solved by an Expert!
Get step-by-step solutions from verified subject matter experts
Step: 2 Unlock
Step: 3 Unlock