

Question: Exercises 23 and 24: Use the table to make a scatterplot and line graph of the data. Global Cell Phone Subscribers (millions) Year 1995 2000
Exercises 23 and 24: Use the table to make a scatterplot and line graph of the data.
Global Cell Phone Subscribers (millions)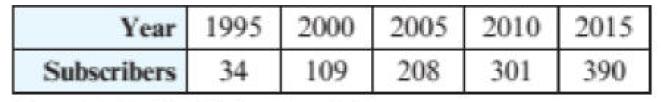
Year 1995 2000 2005 2010 2015 390 Subscribers 34 109 208 301
Step by Step Solution
★★★★★
3.35 Rating (170 Votes )
There are 3 Steps involved in it
1 Expert Approved Answer
Step: 1 Unlock

Subscribers in millions 400 350 300 250 20... View full answer
Question Has Been Solved by an Expert!
Get step-by-step solutions from verified subject matter experts
Step: 2 Unlock
Step: 3 Unlock