

Exercises 4752 present data in the form of tables. For each data set shown by the table,
Question:
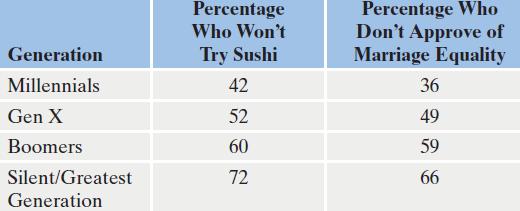
Exercises 47–52 present data in the form of tables. For each data set shown by the table,
a. Create a scatter plot for the data.
b. Use the scatter plot to determine whether an exponential function, a logarithmic function, or a linear function is the best choice for modeling the data.
Hamachiphobia
Fantastic news! We've Found the answer you've been seeking!
Step by Step Answer:
a b A logarithmic function appears to be ...View the full answer

Answered By
Benard Ndini Mwendwa
I am a graduate from Kenya. I managed to score one of the highest levels in my BS. I have experience in academic writing since I have been working as a freelancer in most of my time. I am willing to help other students attain better grades in their academic portfolio. Thank you.
107+ Reviews
240+ Question Solved
Related Book For 

Question Posted:
