

Exercises 4752 present data in the form of tables. For each data set shown by the table,
Question:
Exercises 47–52 present data in the form of tables. For each data set shown by the table,
a. Create a scatter plot for the data.
b. Use the scatter plot to determine whether an exponential function, a logarithmic function, or a linear function is the best choice for modeling the data.
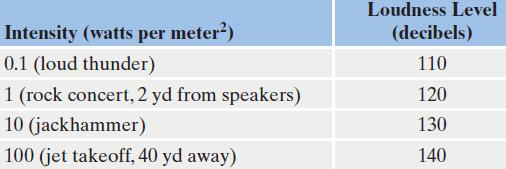
Intensity and Loudness Level of Various Sounds
Fantastic news! We've Found the answer you've been seeking!
Step by Step Answer:
a b A logarithmic function appears to be th...View the full answer

Answered By
Mamba Dedan
I am a computer scientist specializing in database management, OS, networking, and software development. I have a knack for database work, Operating systems, networking, and programming, I can give you the best solution on this without any hesitation. I have a knack in software development with key skills in UML diagrams, storyboarding, code development, software testing and implementation on several platforms.
49+ Reviews
119+ Question Solved
Related Book For 

Question Posted:
