

Question: Group members should develop appropriate functions that model each of the projections shown in Exercise 45. Data from exercise 45 AIDS is taking a deadly
Group members should develop appropriate functions that model each of the projections shown in Exercise 45.
Data from exercise 45
AIDS is taking a deadly toll on southern Africa. Describe how to use the techniques that you learned in this section to obtain a model for African life span using projections with AIDS, shown by the red graph in the figure. Let x represent the number of years after 1985 and let y represent African life span in that year.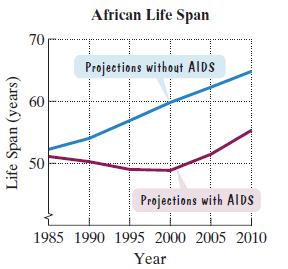
Life Span (years) 70 60 50 African Life Span Projections without AIDS Projections with AIDS 1985 1990 1995 2000 2005 2010 Year
Step by Step Solution
3.39 Rating (155 Votes )
There are 3 Steps involved in it
To model the African life span based on the given graph we need to use regression techniques to deve... View full answer

Get step-by-step solutions from verified subject matter experts