

Question: In Example 1, we used two data points and an exponential function to model the population of the United States from 1970 through 2010. The
In Example 1, we used two data points and an exponential function to model the population of the United States from 1970 through 2010. The data are shown again in the table. Use all five data points to solve Exercises 66–70.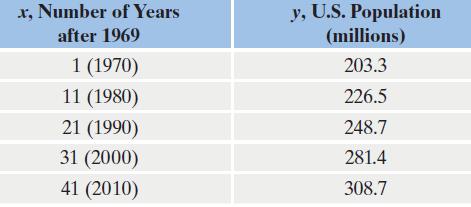
Data from example 1
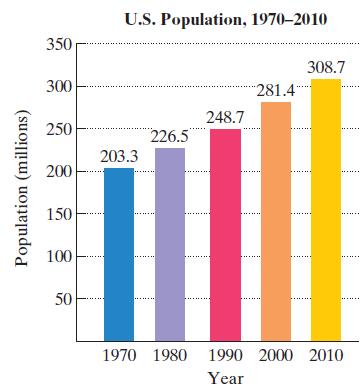
The graph in Figure 4.22 shows the U.S. population, in millions, for five selected years from 1970 through 2010. In 1970, the U.S. population was 203.3 million. By 2010, it had grown to 308.7 million.
Figure 4.22
Use the values of r in Exercises 66–69 to select the two models of best fit. Use each of these models to predict by which year the U.S. population will reach 335 million. How do these answers compare to the year we found in Example 1, namely 2020? If you obtained different years, how do you account for this difference?
x, Number of Years after 1969 1 (1970) 11 (1980) 21 (1990) 31 (2000) 41 (2010) y, U.S. Population (millions) 203.3 226.5 248.7 281.4 308.7
Step by Step Solution
3.46 Rating (162 Votes )
There are 3 Steps involved in it
According to the exponential model the US population will reac... View full answer

Get step-by-step solutions from verified subject matter experts