

Question: Summarize the attached article ISSUES & CONTROVERSIES COSTS, By Bobby Milstein, Jack Homer, Peter Briss, Deron Burton, and Terry Pechacek Why Behavioral And Environmental Interventions


Summarize the attached article


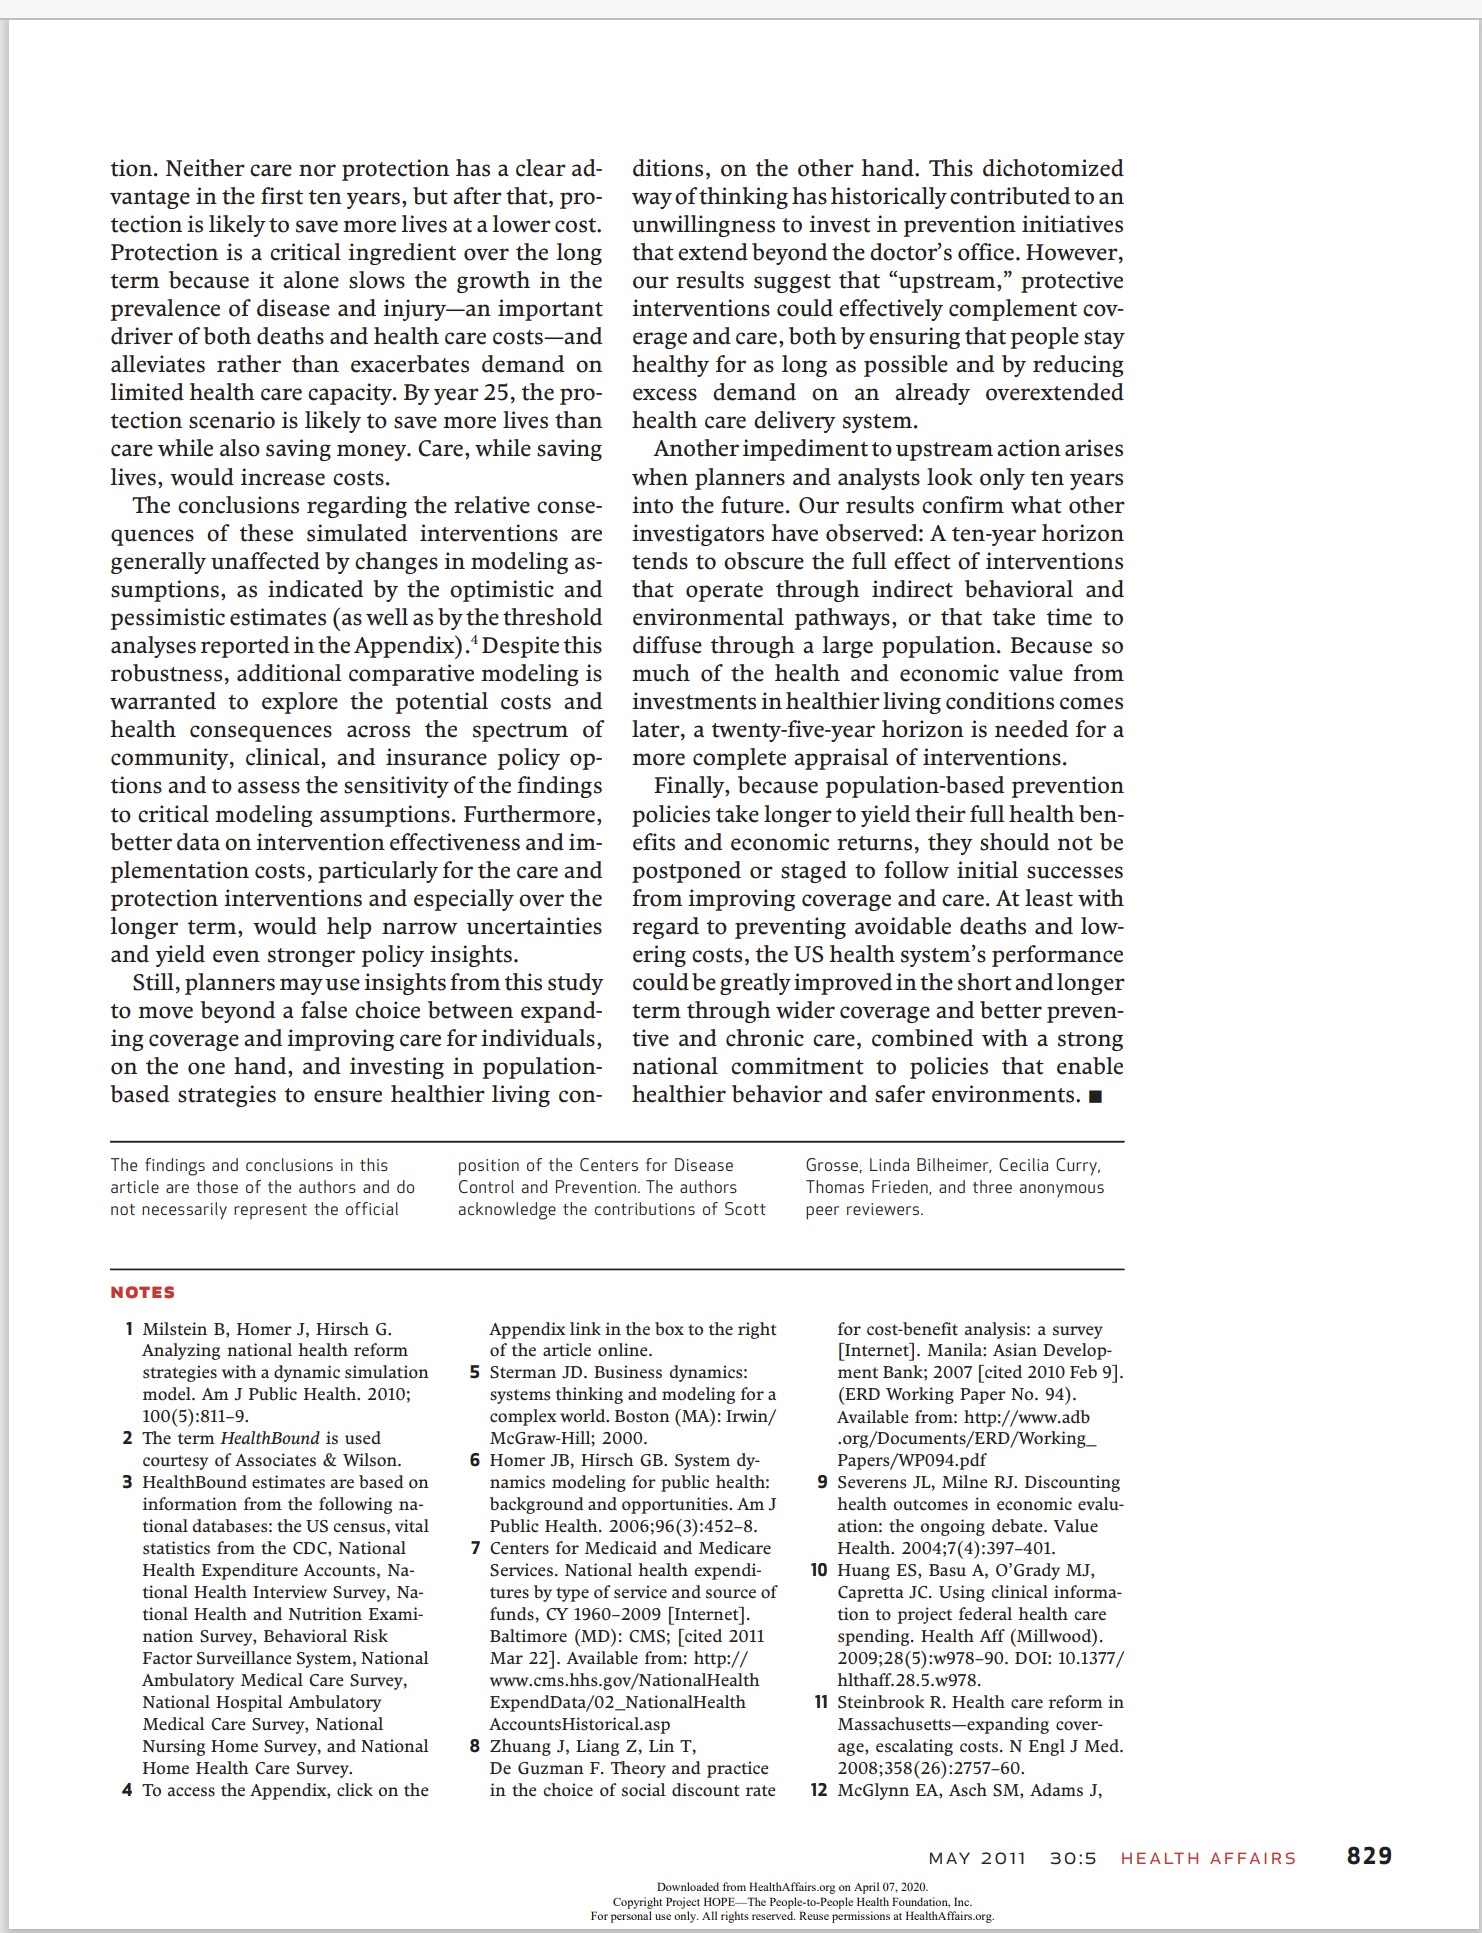
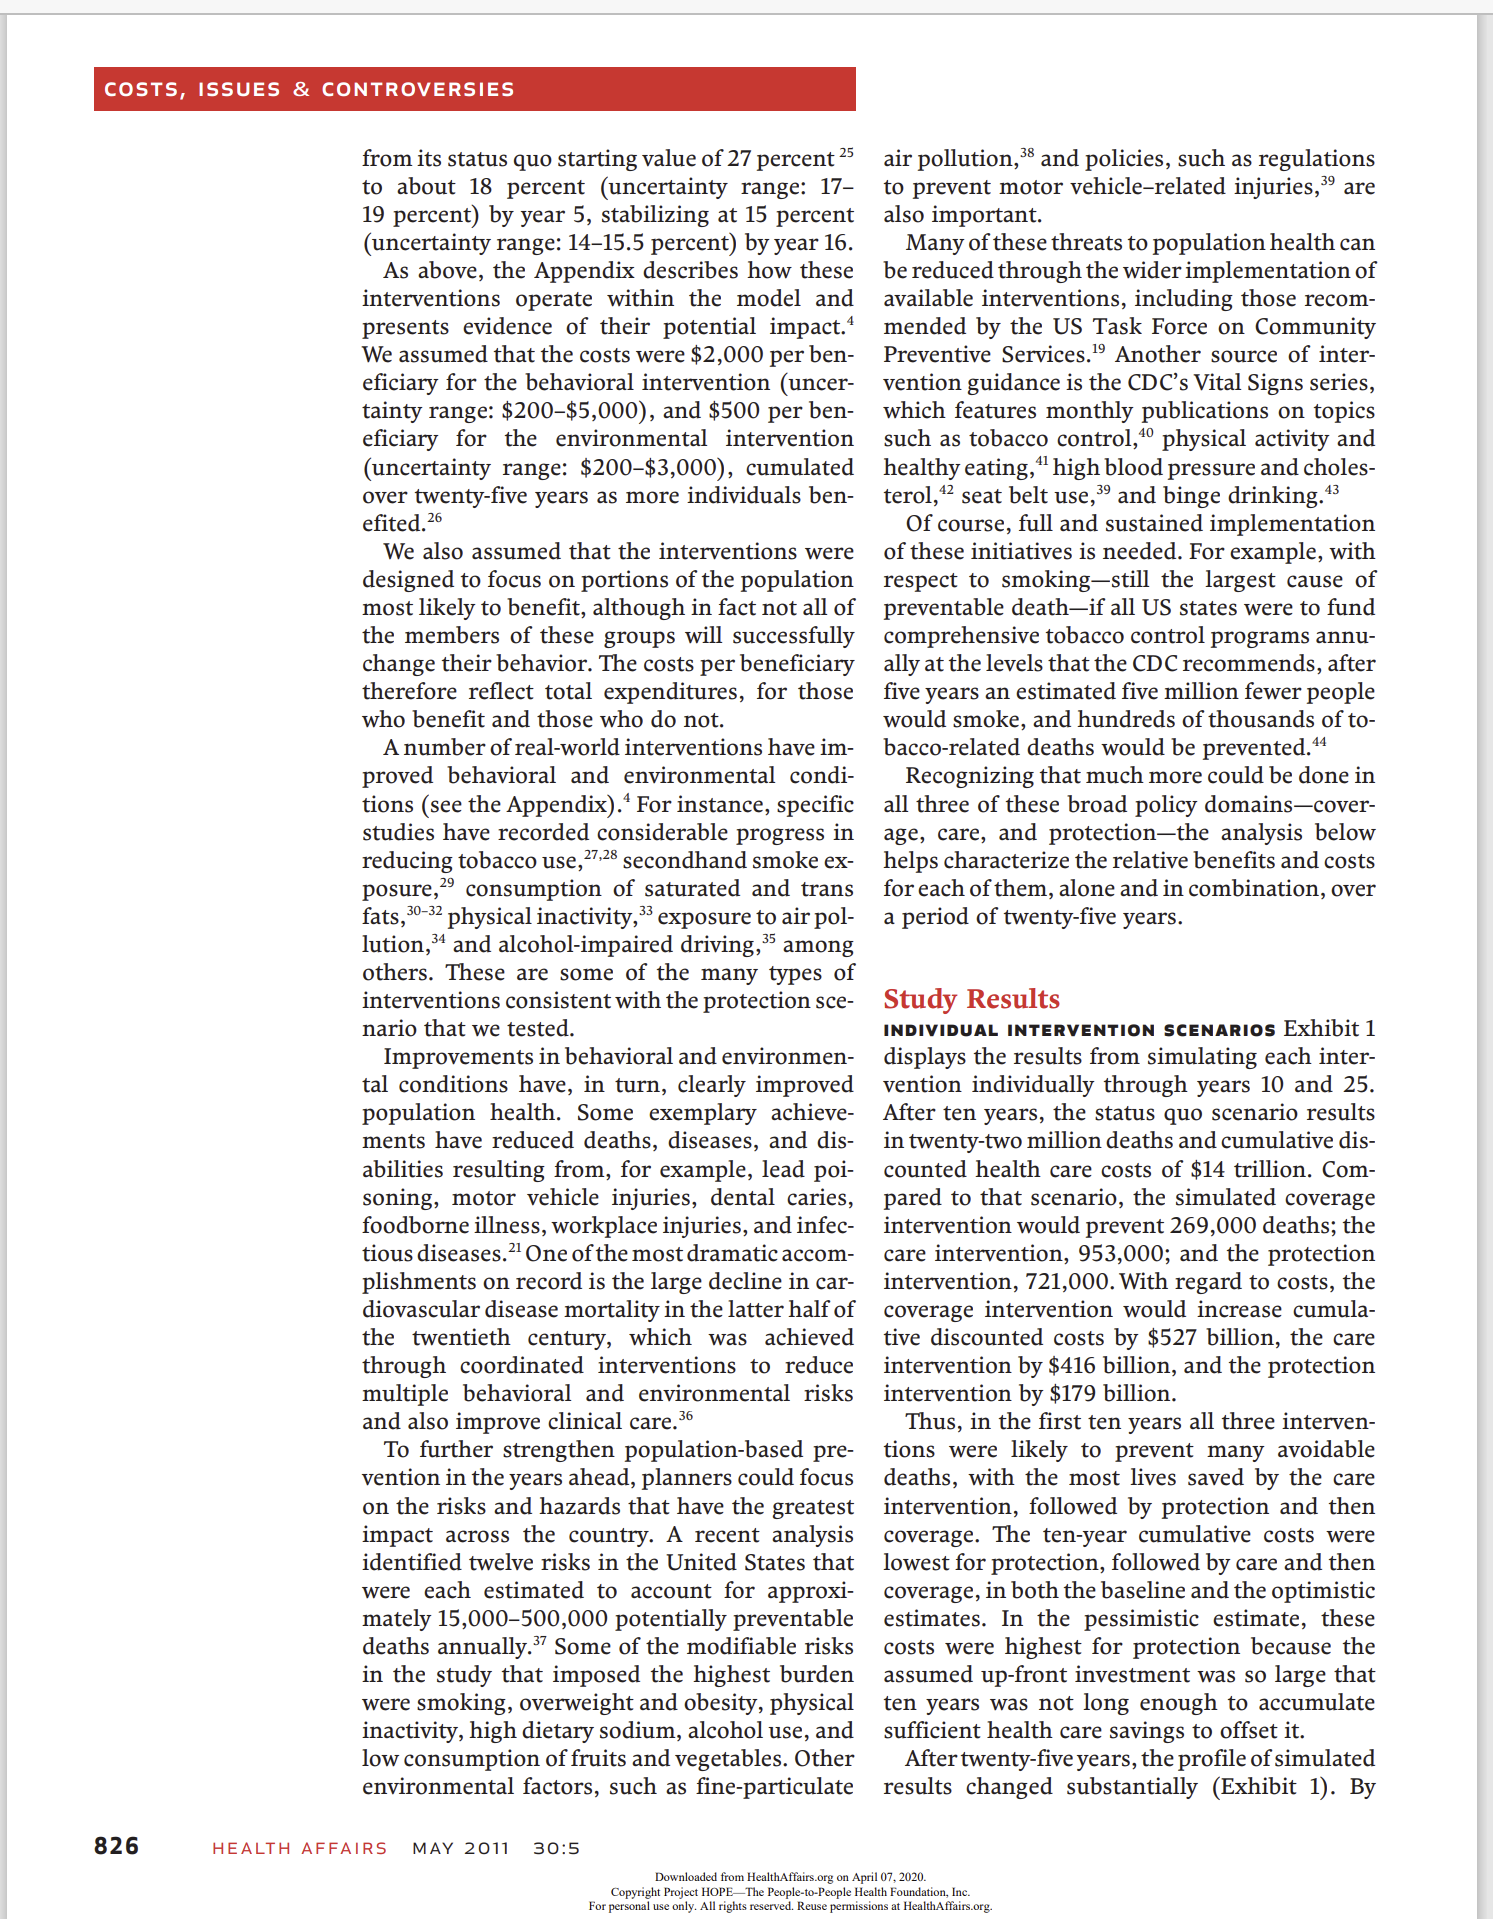
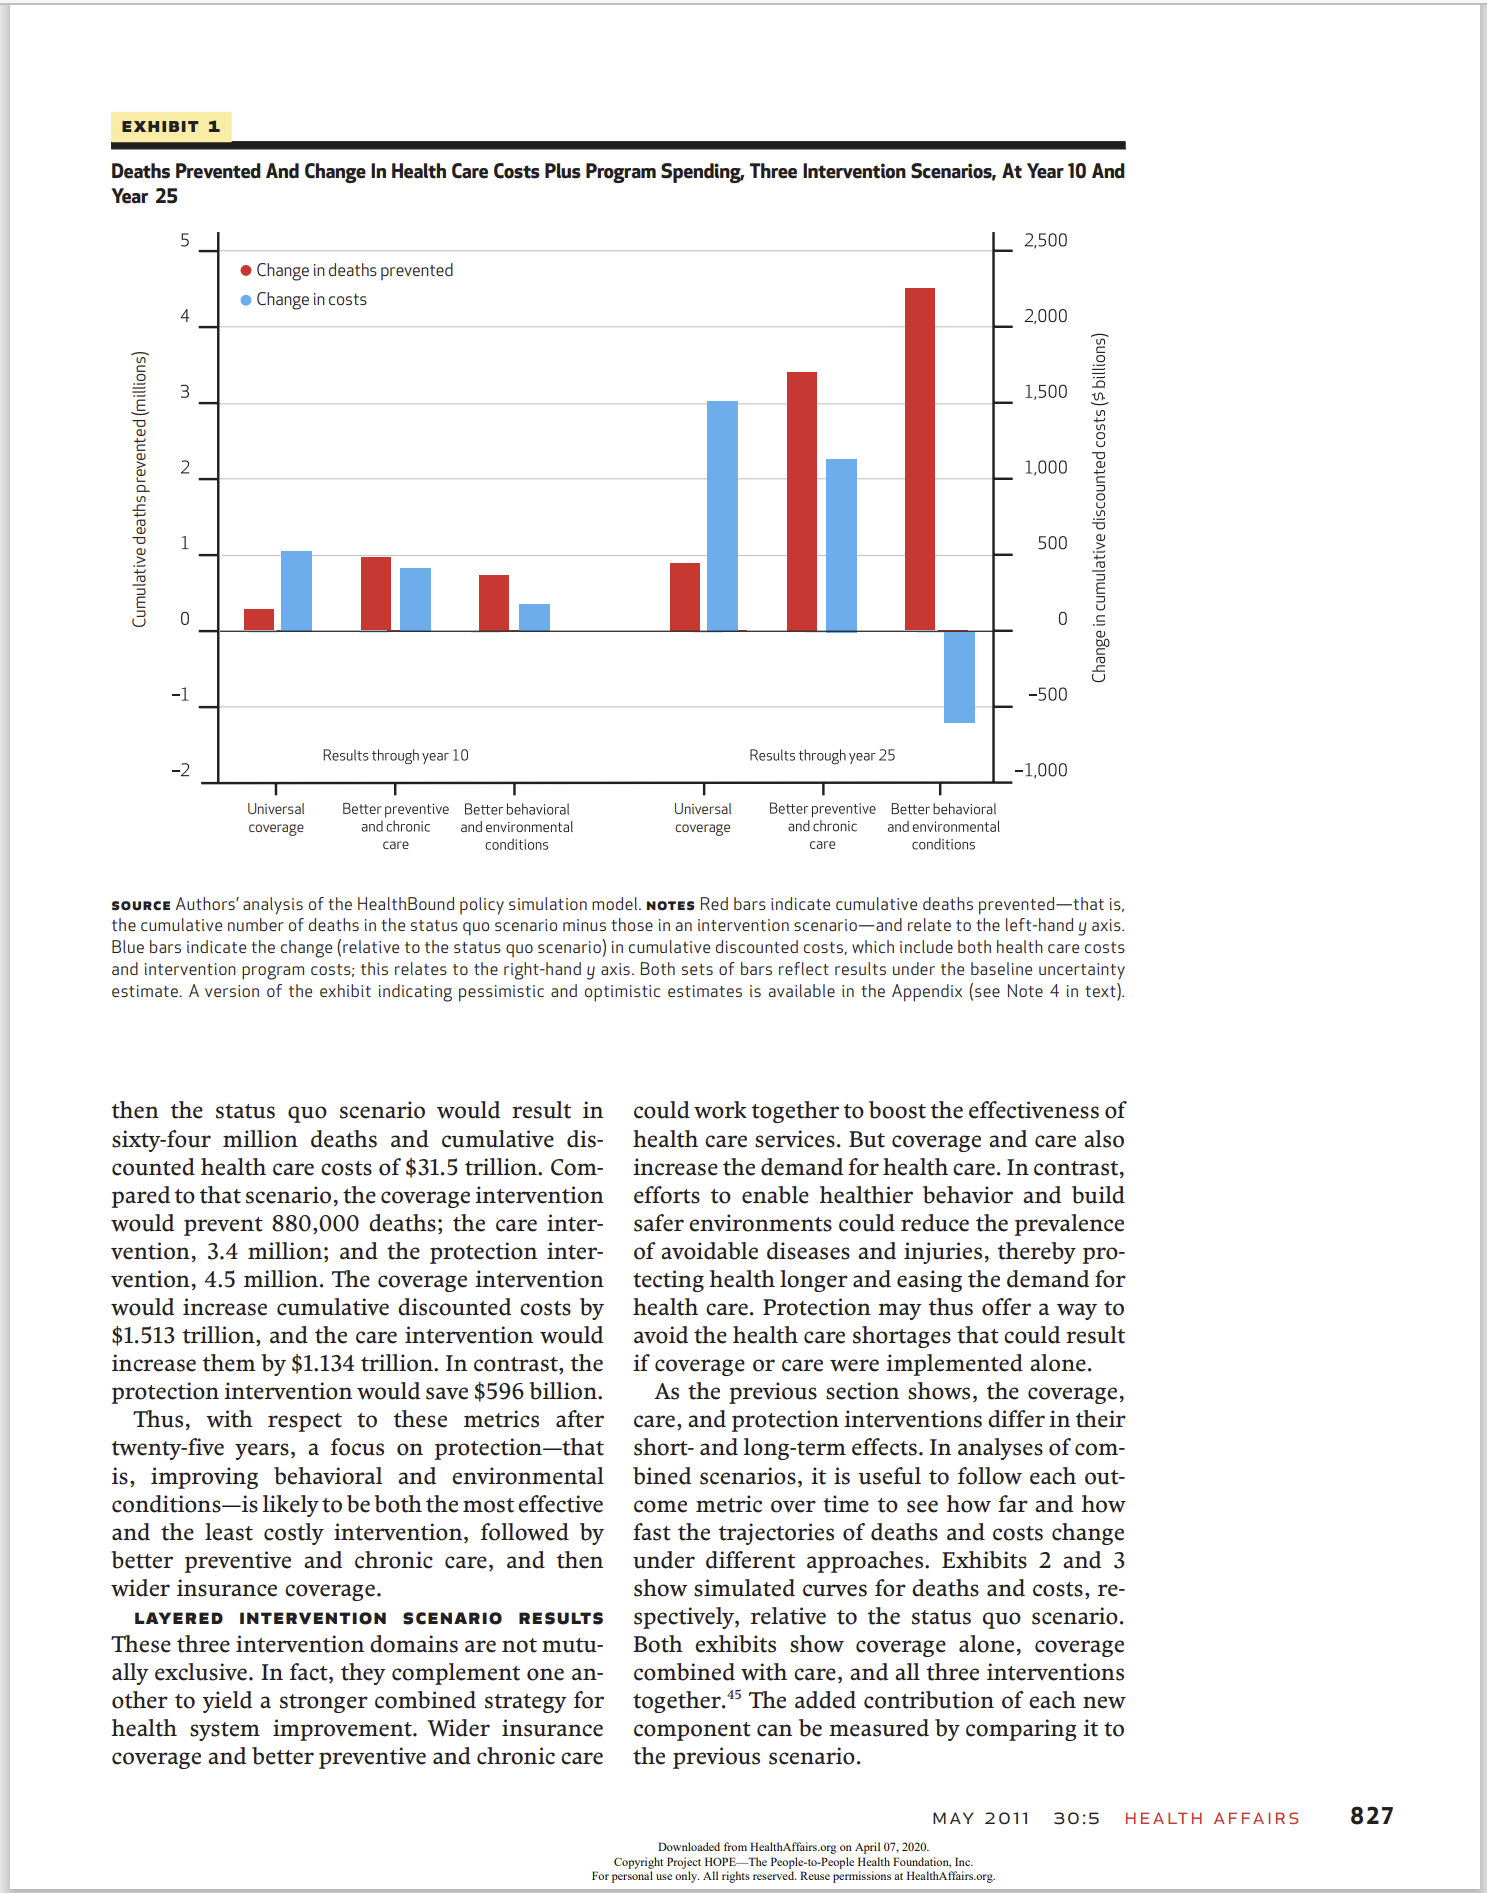
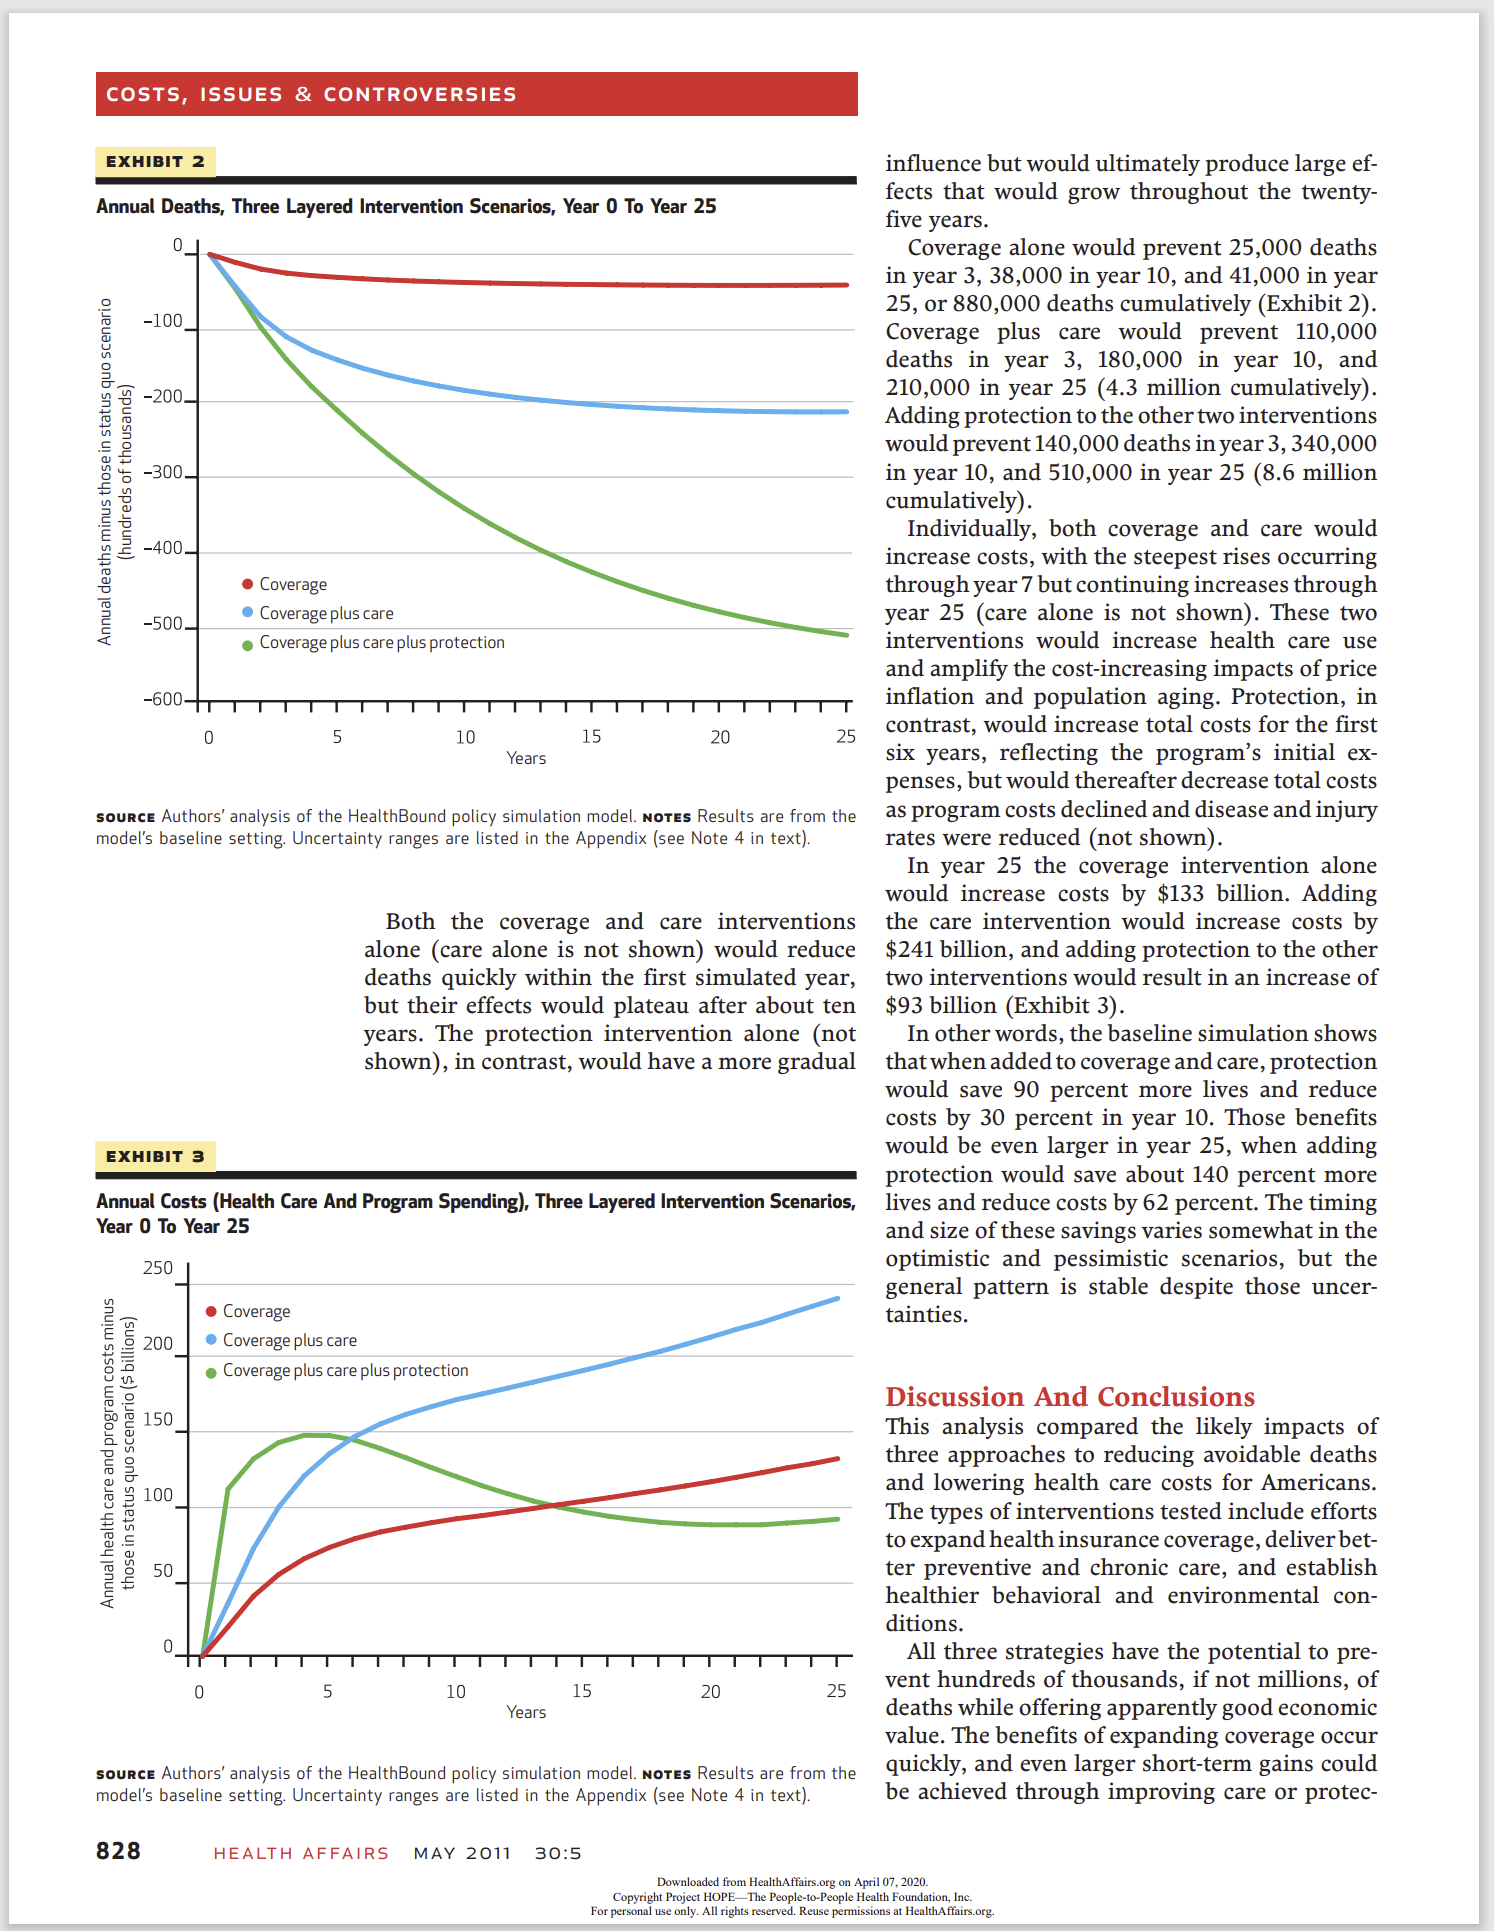
ISSUES & CONTROVERSIES COSTS, By Bobby Milstein, Jack Homer, Peter Briss, Deron Burton, and Terry Pechacek Why Behavioral And Environmental Interventions Are Needed To Improve Health At Lower Cost ABSTRACT We used a dynamic simulation model of the US health system to test three proposed strategies to reduce deaths and improve the cost- effectiveness of interventions: expanding health insurance coverage, delivering better preventive and chronic care, and protecting health by enabling healthier behavior and improving environmental conditions. We found that each alone could save lives and provide good economic value, but they are likely to be more effective in combination. Although coverage and care save lives quickly, they tend to increase costs. The impact of protection grows more gradually, but it is a critical ingredient over time for lowering both the number of deaths and reducing costs. Only protection slows the growth in the prevalence of disease and injury and thereby alleviates rather than exacerbates demand on limited primary care capacity. When added to a simulated scenario with coverage and care, protection could save 90 percent more lives and reduce costs by 30 percent in year 10; by year 25, that same investment in protection could save about 140 percent more lives and reduce costs by 62 percent. mericans are engaged in a long- standing quest to fundamentally improve the US health system. The Affordable Care Act of 2010 in- stituted a range of provisions to expand insurance coverage; improve health care delivery; and also protect the population's well- being by enabling healthier conditions in homes, workplaces, schools, neighborhoods, and other locations. As this law is implemented and other steps are taken to create a more healthful and affordable system, it is useful to question how these three basic intervention strategiescoverage, care, and protectionaffect the nation's health and economic outcomes, individually or together. How much of an impact can each component have? Are their effects complementary or syner- gistic? How fast can they yield resultsand how long might those effects last? Answering these questions requires a macroscopic analysis of the health system as a whole, with attention to the dynamic processes that connect its distinct parts and produce changes over time. We estimated the relative and combined health and economic impacts from expanding health insurance (referred to in the rest of this paper as coverage); delivering better preventive and chronic care (referred to as care), and enabling healthier behavior and safer environments (re- ferred to as protection). Our study did not ana- lyze the probable effects of the implementation of the Affordable Care Act. Instead, we began all simulation experiments in the early 20005 (based on data availability) and asked what might have happened had the United States taken decisive action in these three areas about a decade ago. In particular, we considered each strategy sep- arately and together by charting their likely con- sequences over a twenty-five-year period. A re- view of these alternative trajectories may help MAY 2011 30:5 Downloaded from Healnlmtmmg on April in Jun), copy-n gin rmeu Herein\" 1'ch lcrtorl'euplc malm iaumamn. m. lurpermml use only All rights mama Reuse pet-mum)\": at HealtliAllnlrs.org HEALTH AFFAIRS DOII Ill]377/hlthaff.2lllll.lll6 HEALTH AFFAIRS 3|], NO. 5 (Zillll. 3237331 QZOll Pro|ett HOPEi The PeoplerlerPeople Health Foundation, Inc, Bobby Mllstein {hmllstein@ crlc gov) ls the coordinator for the Syndemlcs Prevention Network at the Centers for Disease Control and Prevention, ln Atlanta Georgia, Jack Homer ls president of Homer Consulting in Voorhees, New Jersey, Peter Brlss is the medlcal director of the Natlonal Center for Chronic Dlsease Prevention and Health Promotlon, at the Centers for Disease Control and Prevention Dernn Burton is a Commlssloned Corps officer at the Center for Global Health, at the Centers for Disease Control and Prevention Terry Pechaeek is the associate dlrector for science of the Office on Smoking and Health, at the Centers for Disease Control and Prevention 823 COSTS, ISSUES & CONTROVERSIES 824 planners better evaluate their options moving forward. Study Data And Methods This analysis builds on a previously published mathematical model of the US health system developed by the Centers for Disease Control and Prevention (CD C).1 With input from diverse stakeholders, subject-matter experts, and sys- tem scientists, analysts in the agency created the HealthBound policy simulation model to bring more structure, evidence, and creativity to bear on strategic questions about national health policy.Z No analysis can precisely represent the current state ofthe US health system, ifonly because the necessary data involve reporting delays and inevitable uncertainties.We were, however, able to closely approximate observed conditions in the United States around 2003, the last year for which key data were available. The model also relied on numerical assumptions tied to ten na- tional databases} as well as key reference studies (listed in the Appendix).4 Being imperfect, as all models are, this tool does not produce exact forecasts, nor can it pre- dict the effects of a specific initiative or legisla- tive action. It does, however, offer auseful wayof seeing how the US health system tends to re- spond to large-scale interventions. Simulated scenarios let planners compare major types of interventions based on their respective direction and timing, as well as the magnitude of expected costs and benefits. MODEL OVERVIEW The model's structure and data sources have been described elsewhere.1 In brief, HealthBound is a deterministic, differen- tial equationstype model built according to the methodology of system dynamics modeling.is It features several hundred interacting elements that describe essential relationships at the na- tional level that affect population health status, health equity, and health care costs over time. Many sorts of national policiesspanning health care delivery and financing as well as behavioral, environmental, and social interven- tionscan be compared within this single ana- lytic framework. For this analysis we extended a previously pub- lished version of the model to create a more realistic status quo scenario that incorporated conservative estimates for health care price in- flation and population aging (see the Appen- dix) .4 Over a twenty-fiveyear period, this revised status quo scenario showed steady and sizable increases in mortality and health care costs. We compared all of the intervention scenarios de- scribed here to this status quo scenario. In each HEALTH AFFAIRS MAY 2011 3015 simulation, the interventions go into effect at Time 0 (circa 2003) and remain in effect throughout twenty-five years. INTERVENTION ANALYSIS We compared each simulated intervention to the status quo sce nario along two summary measures: deaths pre vented and costs. Deaths can be prevented in the model by providing better care for people with existing diseases and injuries, or by preventing disease and injury in the first place. The coverage and care interventions do some of each directly, by increasing the number of patients receiving appropriate disease and injury management (chronic care) as well as through clinical risk factor management (preventive care). The direct effects of protection, in contrast, are purely preventive, because this strategy im proves both health-related behavior and envi ronmental conditions that affect the onset of disease and injury. By reducing demand on the health care delivery system, protection also helps alleviate the shortage of clinical capacity to care for people with existing health problems. In this indirect way it can also ultimately lead to more people's getting better care. All of these effects, both direct and indirect, are calculated in the model. The cost metric combines health care costs and the estimated costs of implementing the inter- ventions. The model includes all reported health care costs associated with personal health ser- vices provided by hospitals, office-based physi- cians, nursing homes and home health care, and dental and other health care providers; prescrip- tion drugs; other medical products; and admin- istrative costs of health insurance. Together, these account for more than 90 percent of all health-related spending in the United States.7 Intervention costs are more difficult to esti- mate, especially for broad classes of interven- tions that may be implemented through diverse strategies. For this analysis we tested both higher and lower estimates to reect the uncertainty about practical intervention details. The range of uncertainty varies according to the available evidence: The widest interval is associated with protection, followed by care and then coverage. When reporting cost results on a cumulative ba- sis, we applied an annual discount rate of 3 percentf"9 Parameters for the direct health effects and implementation costs for each intervention were set using baseline estimates as well as uncer tainty ranges that run from \"pessimistic\" (that is, a less effective and more costly scenario) to "optimistic" (that is, a more effective and less costly scenario). For each simulated scenario, we accordingly report baseline, pessimistic, and optimistic results (see the Appendix for How nloadui from HealIhAarn org on April :17. 202" Copyright Pmym HOPE/7 Hm Penplcrmrl'eaple Hunk raumnun. [m m permml use only All nglllx men-m Ruuse permissions in Hummus);- org parameter values).' We report cumulative results for deaths and time-discounted costs at years 10 and 25. A tenyear time horizon is generally used by the Congressional Budget Office, but this time frame has been criticized as inadequate to show the full effects of interventions that prevent disease on set or alter the trajectories ofchronic diseases."J Thus, we show longer-term results as well. Previous analyses using this model have shown that expanding primary care capacity can greatly enhance the ability of coverage and care interventions to improve health and cost effectiveness.1 We therefore conducted sensitiv ity tests to examine how the sufficiency of pri mary care capacity might affect each simulated scenario. Those tests, reported in the Appendix,4 did not meaningfully alter the overall pattern of results. INTERVENTION SCENARIDS > EXTENDING HEALTH INSURANCE (COVER- AGE): A simulated intervention to extend health insurance to all people, similar to ongoing pro grams in Massachusettsu and probably covering a largerproportion of the population than will be achieved under the Affordable Care Act, causes the uninsured fraction of the US population to decline from its status quo starting value of 15.6 percent to 5 percent by year 3, and to less than 1 percent by year 8 and beyond. The cost impacts of this intervention include the greater costs of the additional services and medical prod- ucts used by the newly insured, minus cost sav- ings from fewerhospitalizations and visits to the emergency department. The costs also include outlays for providing health care to those whose deaths are averted as a result of the reduction of these events, as well as the costs of administering the insurance program. Based on the Massachusetts experience, we assumed that the amortized cost of administer- ing the program was $20 per additional person covered per year (uncertainty range: $10-$40). p DELIVERING BETTER PREVENTIVE AND CHRONIC CARE (CARE): Research suggests that it is possible to deliver better health carepar- ticularly preventive and chronic carein the United States, where adherence to recom- mended guidelines for disease and injury screen ing and management is relatively low.'HS A si mulated intervention to improve providers' adherence to guidelines for preventive and chronic care causes such adherence to rise rela- tively quickly from its status quo value of 70 per cent,16 reaching about 83 percent (uncertainty range: 8086 percent) by year 5 and stabilizing at 85 percent (uncertaintyrange: 8288 percent) by year 9. The Appendix describes how this intervention operates within the model and presents evidence of its potential impact.1 We assumed that the amortized cost of programs to help office-based providers adhere to quality guidelines was $10,000 (uncertainty range: $2,000$20,000) per physician per year. A number of real-world interventions have been shown to close gaps in appropriate health care delivery.13 These involve, for example, health information systems oriented toward pre- vention, which trigger interventions such as reminder systems to boost the delivery of effec- tive care; practice work ows that support pre- vention; and efforts to help patients take a greater role in their own care. All of these may be increasingly feasible with the continuing de- velopment of electronic health records. Similar efforts to deliver better preventive and chronic care could begin by identifying a set of high-value services that merit greater attention. For example, cardiovascular disease is the lead- ing cause of death in the United States, and a number of clearly cost-effective preventive ser- vices are available that could greatly reduce its burden. These include the greater use of aspirin by people at risk of recurrent heart attacks or strokes, improved diagnosis and treatment of high blood pressure and high cholesterol, and greater use of smoking cessation treatment.17 The current delivery of some of these services remains low,13 however, and improvements in health care systems to improve their use could yield important health benefits. p ENABLING HEALTHIER BEHAVIOR AND SAFER ENVIRONMENTS (PROTECTION): Re- searchers have shown that many interventions to enable healthier behavior and improve envi- ronmental safety can produce effects immedi- ately and are likely to yield cost-effective, if not cost-saving, returnsbut it generally takes sev- eral years before they have their full impact.\"23 Given the variety of opportunities available in this policy domain, we modeled behavioral and environmental interventions using aggregate es- timates of effectiveness and uncertainty, repre- senting the potential impact across this diverse class of strategies to reduce risk and vulnerability in the population at large. In the simulation, the behavioral intervention caused the fraction of the population engaging in risky behavior such as smoking or physical inactivity to decline from its status quo starting value of 34 percent\" to about 23 percent (uncer- tainty range: 2225 percent) by year 5, stabiliz- ing at 19.5 percent (uncertaintyrange: 1821 per- cent) by year 16. Similarly, the environmental intervention caused the fraction of the popula- tion exposed to unsafe environmentsbecause of air pollution or injury hazardsto decline MAY 2011 3015 HEALTH AFFAIRS Downloadui {mm Hcammn'am org on Apnl :17 202!) Copyright Prawn HOP b7 \"A: Penpicrlorl'enp la H mm M unnauun. [mz I'm pammi m mlly All nglllx men-m Ruuse permuwms a! Hummus";- org 825 COSTS, ISSUES 82 CONTROVERSIES 826 from its status quo starting value of 27 percent 25 to about 18 percent (uncertainty range: 17 19 percent) by year 5, stabilizing at 15 percent (uncertainty range: 14155 percent) by year 16. As above, the Appendix describes how these interventions operate within the model and presents evidence of their potential impact.4 We assumed that the costs were $2,000 per ben- eficiary for the behavioral intervention (uncer- tainty range: $200$5,000), and $500 per ben- eficiary for the environmental intervention (uncertainty range: $200$3,000), cumulated over twenty-five years as more individuals ben- efited.26 We also assumed that the interventions were designed to focus on portions of the population most likely to benet, although in fact not all of the members of these groups will successfully change their behavior. The costs per beneficiary therefore reect total expenditures, for those who benet and those who do not. A number of real-world interventions have im- proved behavioral and environmental condi- tions (see the Appendix).4 For instance, specific studies have recorded considerable progress in reducing tobacco use?!\" secondhand smoke ex- posure,\" consumption of saturated and trans fats,\"HZ physical inactivity,33 expo sure to air pol- lution,31 and alcoholimpaired driving,35 among others. These are some of the many types of interventions consistent with the protection sce- nario that we tested. Improvements in behavioral and environmen- tal conditions have, in turn, clearly improved population health. Some exemplary achieve- ments have reduced deaths, diseases, and dis- abilities resulting from, for example, lead poi- soning, motor vehicle injuries, dental caries, foodborne illness, workplace injuries, and infec- tious diseases.Zl One ofthe mostdramatic accom- plishments on record is the large decline in car- diovascular dis ease mortality in the latter half of the twentieth century, which was achieved through coordinated interventions to reduce multiple behavioral and environmental risks and also improve clinical care.'6 To further strengthen populationbased pre- vention in the years ahead, planners could focus on the risks and hazards that have the greatest impact across the country. A recent analysis identified twelve risks in the United States that were each estimated to account for approxi- mately 15,000500,000 potentially preventable deaths annually:7 Some of the modifiable risks in the study that imposed the highest burden were smoking, overweight and obesity, physical inactivity, high dietary sodium, alcohol use, and low consumption of fruits and vegetables. Other environmental factors, such as ne-particulate HEALTH AFFAIRS MAY 2011 30:5 air pollution,\" and policies, such as regulations to prevent motor vehiclerelated injuries,39 are also important. Many of these threats to population health can be reduced through the wider implementation of available interventions, including those recom- mended by the US Task Force on Community Preventive Services.19 Another source of inter- vention guidance is the CDC's Vital Signs series, which features monthly publications on topics such as tobacco control,10 physical activity and healthy eatingfl high blood pres sure and choles- terol,\" seat belt use,\" and binge drinking.'3 Of course, full and sustained implementation of these initiatives is needed. For example, with respect to smokingstill the largest cause of preventable deathif all US states were to fund comprehensive tobacco control programs annu- ally at the levels that the CDC recommends, after five years an estimated five million fewer people would smoke, and hundreds of thousands of to- bacco-related deaths would be prevented.\" Recognizing that much more could be done in all three of these broad policy domainscover- age, care, and protectionthe analysis below helps characterize the relative benets and costs for each of them, alone and in combination, over a period of twenty-five years. Study Results INDIVIDUAL INTERVENTION SCENARIOS Exhibit 1 displays the results from simulating each inter- vention individually through years 10 and 25. After ten years, the status quo scenario results in twenty-two million deaths and cumulative dis- counted health care costs of $14 trillion. Com- pared to that scenario, the simulated coverage intervention would prevent 269,000 deaths; the care intervention, 953,000; and the protection intervention, 721,000.With regard to costs, the coverage intervention would increase cumula- tive discounted costs by $527 billion, the care intervention by $416 billion, and the protection intervention by $179 billion. Thus, in the first ten years all three interven- tions were likely to prevent many avoidable deaths, with the most lives saved by the care intervention, followed by protection and then coverage. The ten-year cumulative costs were lowest for protection, followed by care and then coverage, in both the baseline and the optimistic estimates. In the pessimistic estimate, these costs were highest for protection because the assumed up-front investment was so large that ten years was not long enough to accumulate sufficient health care savings to offset it. After twenty-five years, the profile of simulated results changed substantially (Exhibit 1). By Downloaded frum HeallliAhirs.urg an April mzuzu. Copyright Project How; I'he neoplasm-rpm Health I'o undauun. [nt in: pan-mm um only All \"gnu reserved Reuse pcnmmnzls at HeallllAtlhrrs,urg \fCOSTS, ISSUES 8: CONTROVERSIES EXHIBIT 2 Annual Deaths, Three Layered Intervention Scenarios. Year D To Year 25 0 -100 (hundreds of thousands) r .L. U D D O I A C: c: 0 Coverage SDD Coverageplus care Annual deaths minus those in status ouo scenario . Coverage plus care plus protection 0 5 10 15 20 2 5 Years sauna: Authors' analysis of the HealthBound policy simulation model Hares Results are From the model's baseline setting. Uncertainty ranges are listed in the Appendix lsee Note 4 in text). Both the coverage and care interventions alone (care alone is not shown) would reduce deaths quickly within the rst simulated year, but their effects would plateau after about ten years. The protection intervention alone (not shown), in contrast, would have a more gradual EXHIBIT 3 Annual Costs (Health Care And Program Spending), Three Layered Intervention Scenarios. Year CI Tn Year 25 250 O C overage Coverage plus care I Coverage plus tareplus protection Annual health Care and program costs minus those In status quo scenario l$ billions) 0 5 IO 15 20 25 Years sconce Authors' analysis of the HealthBound policy Simulation model. NOTES Results are from the model's baseline setting. Uncertainty ranges are listed in the Appendix lsee Note 4 'in text). 828 HEALTH AFFAIRS MAY 2011 3025 Dominate from Heaiiiim' ' Copyright Pruyecl HUPbTlic People is: personal use uni. All rights rexerved inuence but would ultimately produce large ef- fects that would grow throughout the twenty- ve years. Coverage alone would prevent 25,000 deaths in year 3, 38,000 in year 10, and 41,000 in year 25, or 880,000 deaths cumulatively (Exhibit 2). Coverage plus care would prevent 110,000 deaths in year 3, 180,000 in year 10, and 210,000 in year 25 (4.3 million cumulatively). Adding protection to the othertwo interventions would prevent 140,000 deaths in year 3, 340,000 in year 10, and 510,000 in year 25 (8.6 million cumulatively) . Individually, both coverage and care would increase costs, with the steepest rises occurring through year 7 but continuing increases through year 25 (care alone is not shown). These two interventions would increase health care use and amplify the cost-increasing impacts of price ination and population aging. Protection, in contrast, would increase total costs for the rst six years, reecting the program's initial ex- penses, but would thereafter decrease total costs as program costs declined and disease and injury rates were reduced (not shown). In year 25 the coverage intervention alone would increase costs by $133 billion. Adding the care intervention would increase costs by $241 billion, and adding protection to the other two interventions would result in an increase of $93 billion (Exhibit 3). In other words, the baseline simulation shows that when added to coverage and care, protection would save 90 percent more lives and reduce costs by 30 percent in year 10. Those benefits would be even larger in year 25, when adding protection would save about 140 percent more lives and reduce costs by 62 percent. The timing and size of these savings varies somewhat in the optimistic and pessimistic scenarios, but the general pattern is stable despite those uncer- tainties. Discussion And Conclusions This analysis compared the likely impacts of three approaches to reducing avoidable deaths and lowering health care costs for Americans. The types ofinterventions tested include efforts to expand health insurance coverage, deliverbet ter preventive and chronic care. and establish healthier behavioral and environmental con- ditions. All three strategies have the potential to pre- vent hundreds of thousands, if not millions, of deaths while offering apparently good economic value. The benets of expanding coverage occur quickly, and even larger short-term gains could be achieved through improving care or protec- on April U7, ZDZU uplr: mam Ioundaliun. Inc "pennlsslims at HealrliAtt'airsmg.
Step by Step Solution
There are 3 Steps involved in it

Get step-by-step solutions from verified subject matter experts