

Question: In Exercises 9497, determine whether each statement makes sense or does not make sense, and explain your reasoning. Because it takes me longer to come
In Exercises 94–97, determine whether each statement makes sense or does not make sense, and explain your reasoning.
Because it takes me longer to come to a stop on a wet road than on a dry road, graph (a) for Exercises 77–78 is the model for stopping distances on wet pavement and graph (b) is the model for stopping distances on dry pavement.
Data from exercise 77-78
a. Use the given functions at the bottom of the previous page to find the stopping distance on dry pavement and the stopping distance on wet pavement for a car traveling at 35 miles per hour. Round to the nearest foot.
b. Based on your answers to part (a), which rectangular coordinate graph shows stopping distances on dry pavement and which shows stopping distances on wet pavement?
c. How well do your answers to part (a) model the actual stopping distances shown in Figure 3.43?
Figure 3.43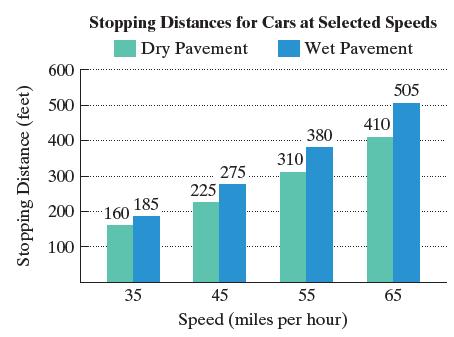
d. Determine speeds on dry pavement requiring stopping distances that exceed the length of one and one-half football fields, or 540 feet. Round to the nearest mile per hour. How is this shown on the appropriate graph of the models?
Q-78
a. Use the given functions at the bottom of the previous page to find the stopping distance on dry pavement and the stopping distance on wet pavement for a car traveling at 55 miles per hour. Round to the nearest foot.
b. Based on your answers to part (a), which rectangular coordinate graph shows stopping distances on dry pavement and which shows stopping distances on wet pavement?
c. How well do your answers to part (a) model the actual stopping distances shown in Figure 3.43 ? d. Determine speeds on wet pavement requiring stopping distances that exceed the length of one and one-half football fields, or 540 feet. Round to the nearest mile per hour. How is this shown on the appropriate graph of the models?
Stopping Distance (feet) 600 500 400 300 200 100 Stopping Distances for Cars at Selected Speeds Dry Pavement Wet Pavement 160 185 35 . 225 310 275.......... 410 380......... 45 55 Speed (miles per hour) 505 65
Step by Step Solution
3.43 Rating (150 Votes )
There are 3 Steps involved in it
a Use the given functions to find stopping distances for 35 miles per hour on dry and wet pavement R... View full answer

Get step-by-step solutions from verified subject matter experts