

The bar graph shows the average number of hours per week that U.S. wives and husbands engaged
Question:
The bar graph shows the average number of hours per week that U.S. wives and husbands engaged in housework in six selected years. Use this information to solve Exercises 115–116.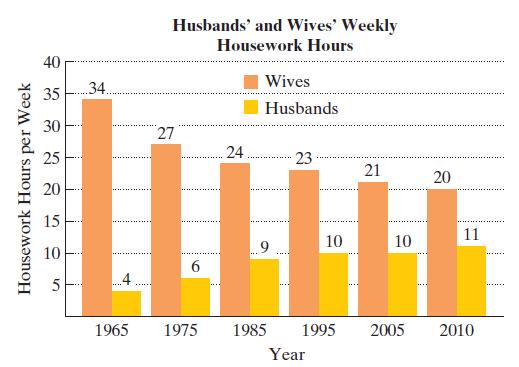 The function f(x) = -3.52 ln x + 34.5 models the wives’ weekly housework hours, f(x), x years after 1964.
a. Use the function to find the number of weekly housework hours for wives in 2010. Round to the nearest hour. Does this function value overestimate or underestimate the number of hours displayed by the graph? By how much?
b. Use the function to project wives’ weekly housework hours in 2025. Round to the nearest hour.
Fantastic news! We've Found the answer you've been seeking!
Step by Step Answer:
a b 2010 is 46 years after 1964 fx352 l...View the full answer

Answered By
Bhartendu Goyal
Professional, Experienced, and Expert tutor who will provide speedy and to-the-point solutions. I have been teaching students for 5 years now in different subjects and it's truly been one of the most rewarding experiences of my life. I have also done one-to-one tutoring with 100+ students and help them achieve great subject knowledge. I have expertise in computer subjects like C++, C, Java, and Python programming and other computer Science related fields. Many of my student's parents message me that your lessons improved their children's grades and this is the best only thing you want as a tea...
2+ Reviews
10+ Question Solved
Related Book For 

Question Posted:
